Work with Grid
Working with Grid in the TreeGrid mode
For information on working with with Grid in the TreeGrid mode, read the TreeGrid mode guide.
Working with columns and cells
The API of DHTMLX Grid allows setting configuration of columns, getting an object of a particular column as well as the parameters of a certain cell.
Setting columns configuration
You can specify the configuration of Grid columns on the fly via the setColumns() method. It takes an array with columns objects as a parameter.
grid.setColumns([
    { id: "a", header: [{ text: "New header for column a" }] },
    { id: "b", header: [{ text: "New header for column b" }] },
    // more columns objects
]);
You can find the full list of the available configuration options of a Grid column here.
Getting configuration of a column
It is possible to return an object with attributes of a column via its id. Use the getColumn() method for this purpose.
const column = grid.getColumn("b"); // ->
// -> { width: 100, id: "b", header: Array(1), $cellCss: {…}, type: "string" }
The method returns an object with configuration of the specified column. You can find the list of properties that the return object can contain here.
Getting configuration of a cell
There is the getCellRect() method that returns an object with coordinates of a cell. The method takes as parameters the ids of the row and the column the cell belongs to:
const rect = grid.getCellRect("1", "c");
// -> { x: 200, y: -40, height: 40, width: 200 }
The return object includes the following attributes:
| x | (number) the X coordinate of a cell |
| y | (number) the Y coordinate of a cell |
| height | (number) the height of a cell |
| width | (number) the width of a cell |
Hiding/showing a column
It is possible to show and hide a column in the grid via the showColumn() and hideColumn() methods.
//showing a column
grid.showColumn(colId);
//hiding a column
grid.hideColumn(colId);
Related sample: Grid. Show / hide column
Since the object of a column has the hidden property, the showColumn() method changes the value of the hidden property to false while the hideColumn() method changes the value of the property to true.
Checking visibility of a column
You can check whether a column is hidden or shown on a page using the isColumnHidden() method. The method returns true, if a column is hidden, and false if it's visible.
grid.isColumnHidden("country"); // -> true|false
Related sample: Grid. Is column hidden
Getting header filter
You may want to manipulate a filter specified in the header of a grid, for example, to set/unset focus on the filter, to change the filter, or clear it. To do that, you should apply the getHeaderFilter() method to get an object with methods of the header filter and apply the necessary method. For example:
// set a value by which a column will be filtered
grid.getHeaderFilter("country").setValue("Brazil");

// set focus on the filter
grid.getHeaderFilter("country").focus();

// remove focus from the filter
grid.getHeaderFilter("country").blur();

// get an object of the filter
const filter = grid.getHeaderFilter("country").getFilter();
console.log(filter);
// -> returns Combobox
// {config: {…}, _uid: 'u1670500020936', events: o, data: d, popup: f, …}

// clear the value set in the filter
grid.getHeaderFilter("country").clear();
Related sample: Grid. Get header filter
Working with rows
Adding/removing a row
Adding a row
You may add a new row into the grid by using the add() method of DataCollection:
grid.data.add({
    "country": "Estonia",
    "population": "1326535",
    "yearlyChange": "0.0070",
    "netChange": "3782",
    "density": "31",
    "area": "45339",
    "migrants": "3911",
    "fert": "1.59",
    "age": "42.4",
    "urban": "0.6790",
    "id": "136"
}, 0);
Removing a row
To remove the necessary row from the grid, apply the remove() method of DataCollection. Pass the id of the row that should be removed to the method:
grid.data.remove("5");
Here is an example of removing a currently selected row:
const cell = grid.selection.getCell();
grid.data.remove(cell.row.id);
Related sample: Grid. Delete row
For more information about the selection functionality in Grid, read the Selection and Work with selection object articles.
Removing all rows
If you need to remove all rows at once, use the removeAll() method of DataCollection:
grid.data.removeAll();
Hiding/showing a row
Starting from v7.0, it is possible to show and hide a row in the grid via the showRow() and hideRow() methods.
//showing a row
grid.showRow(rowId);
//hiding a row
grid.hideRow(rowId);
Related sample: Grid. Show / hide row
Checking visibility of a row
You can check whether a row is hidden or shown on a page using the isRowHidden() method. The method returns true, if a row is hidden, and false if it's visible.
grid.isRowHidden("1"); // -> true|false
Related sample: Grid. Show / hide row
Adding/removing spans
You can manipulate columns and rows spans inside the grid with the help of the corresponding API methods: addSpan(), removeSpan() and getSpan().
Adding spans
In order to add a column/row span into the grid, use the addSpan() method. Pass an object with configuration of a span as a parameter:
grid.addSpan({
    row: "0",
    column: "a",
    rowspan: 5
});
// grid.paint();
These are possible fields of a span object:
| row | (string|number) mandatory, the id of a row |
| column | (string|number) mandatory, the id of a column |
| rowspan | (number) optional, the number of rows in a span |
| colspan | (number) optional, the number of columns in a span |
| text | (string|number) optional, the text in a spanned row/column |
| css | (string) optional, the name of the CSS class that will be applied to a span |
Getting spans
You can return the column/row span a cell is a part of using the getSpan() method. It takes the ids of the row and the column the cell belongs to as parameters:
const span = grid.getSpan("10", "a");
// -> { row: "10", column: "a", colspan: 4, text: "Some header", css: "myCustomColspan" }
As a result, you'll get an object with a span configuration, if any span includes the specified cell. Attributes of a span object are described above.
Removing spans
To remove an existing span, make use of the removeSpan() method. It takes the ids of the row and the column as parameters:
grid.removeSpan("10", "a");
Working with data
Filtering data
You can filter grid data by the specified criteria with the help of the filter() method of DataCollection. The method takes as a parameter an object with the properties described below:
| rule | (object|function) the filtering criteria. It can be:
|
| config | (object) optional, an object with the following properties:
|
grid.data.filter(function (item) {
  return item.a > 0 && item.b !== "Apple";
});

grid.data.filter(function (item) {
  return item.a > 0 && item.b !== "Apple";
}, {
  add: true
});

grid.data.filter({
  by: "a",
  match: "Orange",
  compare: function (value, match, item) {
    if (item.a !== "Some") {
      return val === "New";
    }
    return false;
  }
}, {
  add: true,
});
Related sample: Grid. Basic filter
Sorting data
It is possible to sort data in the grid via the sort() method of DataCollection. The method takes two parameters:
| rule | (object) an object with parameters for sorting. It can take the following attributes:
|
| config | (object) defines the parameter of sorting. It takes one attribute:
|
grid.data.sort(
    {
        by:"a",
        dir:"desc",
        as: item => (item.toUpperCase())
    },
    { smartSorting: true }
);
Related sample: Grid. Sorting
Sorting by multiple columns
The described functionality requires PRO version of the DHTMLX Grid (or DHTMLX Suite) package.
You can sort Grid by multiple columns simultaneously.
Related sample: Grid. Sorting by multiple columns (multisorting)
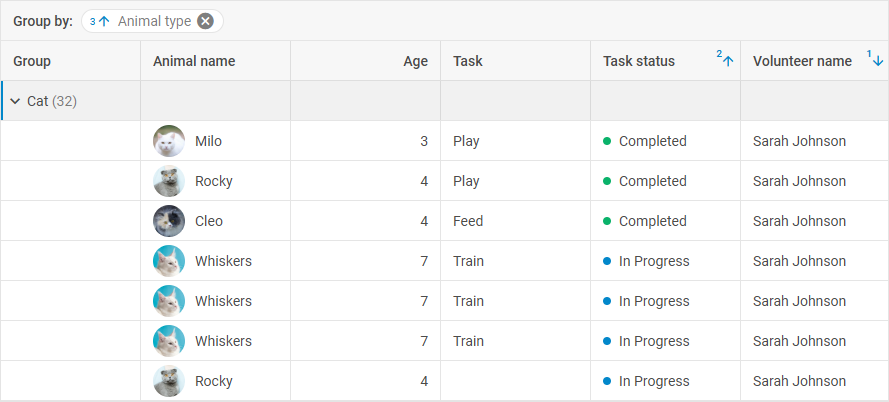
Multi-sorting is enabled on initialization of the component. In the example below Grid data is sorted with the help of the sort() method of DataCollection by several columns:
const grid = new dhx.Grid("grid_container", {
    columns: [
        // columns config
    ],
    editable: true,
    group: {
        order: ["animal_type"] // group by the `animal_type` field
    },
    groupable: true, // enables grouping functionality, false by default
    data: dataset
});

grid.data.sort({ by: "volunteer_name", dir: "desc" }, { smartSorting: true });
grid.data.sort({ by: "task_status", dir: "asc" });
grid.data.sort({ by: "animal_type", dir: "asc" });
Related sample: Grid. Grouping with sorting by multiple columns (multisorting)
If you need to disable the multi-sorting ability, set the multiSort Grid property to false.
const grid = new dhx.Grid("grid_container", {
    columns: [
        // columns config
    ],
    multiSort: false,
    data: dataset
});
Custom sorting
You can also specify the rule attribute in a passed object instead of the default ones and set a custom function for sorting. For example:
grid.data.sort({
    rule: (a, b) => a.id > b.id ? 1 : (a.id < b.id ? -1 : 0)
});
Getting the sorting state
To get the current state of sorting data in Grid, use the getSortingStates() method of DataCollection. The method allows getting the result of sorting data by multiple columns and returns an array of objects with the following properties:
| by | (string | number) the id of a data field to sort by |
| dir | (string) the direction of sorting: "asc" or "desc" |
| as | (function) a custom function of converting values before comparing |
| rule | (function) a custom sorting function |
| smartSorting | (boolean) (if applied) specifies whether a sorting rule should be applied each time after changing the data set |
const state = grid.data.getSortingStates();
// -> [{by: "country", dir: "desc"}, {by: "population", dir: "desc"}]
Editing data
You can easily edit the desired cell of a grid with the help of the editCell() method. It takes two parameters:
| rowId | (string, number) the id of a row |
| colId | (string, number) the id of a column |
For example, you can edit the first cell of the "project" column like this:
grid.editCell(grid.data.getId(0), "project");
Related sample: Grid. Edit the first cell
To finish editing of a cell, use the editEnd() method. The method takes a boolean value as a parameter to define whether the edited data will be saved after the editing of a cell is complete (if true, the made changes won't be saved).
grid.editEnd(); // the edited data will be saved

grid.editEnd(true); // the edited data won't be saved
The editEnd() method does not work if the type of the column editor is defined as checkbox.
Exporting data
You can easily export data of Grid into the Excel, CSV, PDF, or PNG format. Besides the standard functionality of the Export module methods described below, you can also provide advanced configuring of parameters for Grid export via the Grid exportConfig property.
Exporting data to Excel
Since v9.2 DHTMLX Grid uses the WebAssembly-based library Json2Excel to enable the export to Excel functionality and the xlsx() method of the Export module to export data from Grid into an Excel file. Export is processed at the worker.js file of the Json2Excel library (the default link is https://cdn.dhtmlx.com/libs/json2excel/next/worker.js?vx). You can use either the public export server or a local export server.
Thus, to have the possibility of exporting files you need to:
- call the
xlsx()method of theExportmodule. The method takes an object with export settings as a parameter (all settings are optional) and returns a promise of data export.- if you use the public export server, you don't need to specify the link to it, since it is used by default
- if you use your own export server, you need to:
- install the Json2Excel library
- provide a local path to the worker.js file as the
urloption: use"../libs/json2excel/x.x/worker.js?vx"for a specific version (replacex.xwith the version deployed on your server).
grid.export.xlsx({
    url: "../libs/json2excel/x.x/worker.js?vx", // the path to the export module, if a local export server is used
    name: "my_file", // the name of a ready Excel file, "grid" by default
    tableName: "grid", // the name of a sheet with grid data in the Excel file, "data" by default
    dateFormatMask: "mm.dd.yy" // the date format mask for Excel, "dd/mm/yy" by default
})
    .then(() => console.log("success"))
    .catch(() => console.log("failure"))
    .finally(() => console.log("finished"));
Read the details on dates formatting in Excel in the related Excel documentation.
Related sample: Grid. Export to xlsx and csv
The export module server used in the Suite versions up to v9.1 is still available. You can either set the path to the public export server as:
grid.export.xlsx({
    url: "//export.dhtmlx.com/excel"
});
or provide a local path to the export module on your computer as a value of the url property of the export method.
Exporting data to CSV
You can export data from Grid to the CSV format with the csv() method of the Export module. The method takes an object with export settings as a parameter (all settings are optional) and returns a promise of data export.
grid.export.csv({
    name: "my_file", // the name of a ready CSV file, "grid" by default
    rowDelimiter: "\t", // the delimiter used to separate rows, "\n" (newline) by default
    columnDelimiter: ";" // the delimiter used to separate columns, "," (comma) by default
})
    .then(() => console.log("success"))
    .catch(() => console.log("failure"))
    .finally(() => console.log("finished"));
Related sample: Grid. Export to xlsx and csv
The csv() method returns a CSV string with Grid data.
Exporting data to PDF
The pdf() method of the Export module allows you to export data from Grid into a PDF file. The method takes an object with export settings as a parameter (all settings are optional) and returns a promise of data export.
grid.export.pdf({
    pdf: {
        format: false, // the format of the output file, "A4" by default
        scale: 0.75, // the scale of the grid rendering (between 0.1 and 2)
        displayHeaderFooter: true // defines whether to display the header and footer, false by default
    },
    theme: "dark" // the exported theme, "light" by default
})
    .then(() => console.log("success"))
    .catch(() => console.log("failure"))
    .finally(() => console.log("finished"));
Related sample: Grid. Export to PDF/PNG
Exporting data to PNG
The png() method of the Export module allows you to export data from Grid into a PNG file. The method takes an object with export settings as a parameter (all settings are optional) and returns a promise of data export.
grid.export.png({
    theme: "dark" // the exported theme, "light" by default
})
    .then(() => console.log("success"))
    .catch(() => console.log("failure"))
    .finally(() => console.log("finished"));
Related sample: Grid. Export to PDF/PNG
Extended export configuration settings
This functionality requires PRO version of the DHTMLX Grid (or DHTMLX Suite) package.
There is a possibility to provide an advanced configuring of parameters for Grid export into the CSV, XLSX, PDF, and PNG formats with the exportConfig property.
Unlike the standard export, exportConfig allows you to dynamically modify the structure and content of the resulting document at the moment the export function is called. With this property, you can:
- filter data: exclude specific rows, columns, or spans by returning
nullin the corresponding callback methods - transform content: modify headers, format values, or strip HTML templates to ensure data is displayed correctly in spreadsheet editors
- define format-specific settings: set delimiters for CSV, date masks for Excel, or visual themes for PDF
- adjust styling: override Grid properties (such as row height) specifically for the exported file
The exportConfig property is a callback function that takes the following parameters:
| Parameter | Description |
|---|---|
config | (IGridConfig) the current configuration of a Grid instance |
exportType | (string) the type of export being performed: "pdf", "png", "csv", or "xlsx" |
The returned configuration object may contain the following properties:
columns- (function) a function for column transformation; returningnullexcludes the column from the exportdata- (function) a function for filtering or modifying row data; returningnullexcludes the row from the final filespans- (function) a function to handle cell merging (spans); returningnullignores the span in the exporttypeConfig- (object) an object containing unique settings for the specific format (filenames, delimiters, themes)- Grid properties - any Grid property that should be overridden (e.g.,
headerRowHeight) set as akey:valuepair, where the key is the property name and the value is the property value to be applied only to the exported state
Example 1: Conditional filtering and formatting
In this example, sensitive data is excluded for all formats, while for PDF/PNG the headers are converted to the uppercase and HTML templates are disabled:
const grid = new dhx.Grid("grid_container", {
    columns: [
        // columns config
    ],
    data:dataset,
    exportConfig: (config, exportType) => ({
        // Column transformation
        columns: (column) => {
            // Completely exclude the "experience_level" column from any export
            if (column.id === "experience_level") return null;

            // For spreadsheet formats (Excel/CSV), keep columns as is
            if (exportType === "xlsx" || exportType === "csv") {
                return column;
            }

            // For PDF/PNG, remove HTML templates and uppercase the headers
            column.template = null;
            column.header[0].text = column.header[0].text.toUpperCase();

            return column;
        },

        // Row data filtering
        data: (row) => {
            // Exclude young animals (age <= 3) from the export
            if (row.animal_age <= 3) return null;

            // Business logic example: do not export dogs to CSV and cats to Excel
            if (exportType === "csv" && row.animal_type === "Dog") return null;
            if (exportType === "xlsx" && row.animal_type === "Cat") return null;

            return row;
        },

        // Adjust the header height specifically for the Excel file
        headerRowHeight: exportType === "xlsx" ? 60 : config.headerRowHeight,
    }),
});
Example 2: Format-specific configuration with typeConfig
The following example shows the use of the typeConfig property to define filenames, CSV delimiters, and XLSX date masks:
const exportConfig = {
    csv: {
        name: "cat_report",      // Resulting CSV filename
        rowDelimiter: "\t",      // Use Tab as row delimiter
        columnDelimiter: ";"     // Use Semicolon as column delimiter
    },
    xlsx: {
        name: "dog_report",      // Resulting Excel filename
        tableName: "Main Report", // Sheet name in the Excel workbook
        dateFormatMask: "dd.mm.yyyy" // Excel-specific date format mask
    },
    pdf: {
        theme: "dark",           // Apply the dark theme to the PDF document
        scale: 0.8,              // Content scaling (80%)
        format: "A4"             // Page format
    }
};

const grid = new dhx.Grid("grid_container", {
    columns: [
        // columns config
    ],
    data:dataset,
    exportConfig: (config, exportType) => ({
        // Pass settings from our object based on the export type
        typeConfig: exportConfig[exportType]
    })
});
Example 3: Filtering spans
If your Grid uses cell merging, you can manage how spans are handled during export. Check the example below:
const grid = new dhx.Grid("grid_container", {
    columns: [
        // columns config
    ],
    data:dataset,
    spans: [
        // span configuration objects
    ],
    exportConfig: (config, exportType) => ({
        spans: (span) => {
            // Exclude cells' merges when exporting to CSV,
            // as the CSV format does not support merged cells
            if (exportType === "csv") return null;
            return span;
        }
    })
});
Related sample: Grid. Custom export logic for PDF, PNG, XLSX, CSV
Grouping data
The described functionality requires PRO version of the DHTMLX Grid (or DHTMLX Suite) package.
You can group row data by column values to make them more suitable for analysis. The Grid row data grouping functionality allows aggregating data in a group, adjusting the appearance, order and configuration of data grouping and rendering statistics in the summary rows.
It is possible to set a predefined Grid configuration to initialize Grid with grouped data or to use the DataCollection API for grouping Grid data.
Related sample: Grid. Grouping
- Data grouping isn't intended for working with
lazyDataProxy - Modifying the values of grouped elements won't modify the aggregated values
- You mustn't change the order of elements grouping by drag-n-drop
Enabling data grouping
To use the row data grouping functionality in Grid, you need to apply the group configuration property of Grid. You can set the group property to true to enable grouping, or to specify it as a configuration object to configure data grouping .
const grid = new dhx.Grid("grid_container", {
    columns: [
        // columns config
    ],
    group: true, // enabling grouping in a grid
    groupable: true
    data: dataset
});
Note that when you initialize Grid with the group configuration property, the tree-like mode is enabled for Grid and it will have the type: tree property in its configuration.
You can also specify what Grid data will be used for grouping using the groupable properties of Grid and of a column.
The groupable property of Grid enables grouping data by the values in all columns via the user interface:
const grid = new dhx.Grid("grid_container", {
    columns: [
        // columns config
    ],
    group: true,
    groupable: true // allowing grouping row data by the values of all columns
    data: dataset
});
The groupable property works only with the group panel.
With the Grid groupable property enabled you can:
- drag column headers to the special grouping area - group panel. Grid will automatically create groups based on the values from these columns
- group data by several fields by moving a column header to the group panel
- sort the grouped data in two ways:
- either by sorting the grouped field beforehand
- or by clicking a group element on the group panel
- edit the nesting level of grouping by modifying the grouping order by either moving elements to the group panel or removing elements from the group panel
Related sample: Grid. Grouping
The groupable property of a column allows grouping data by the values of a certain column via the user interface:
const grid = new dhx.Grid("grid_container", {
    columns: [
        { id: "country", header: [{ text: "Country" }], groupable: true },
        { id: "population", header: [{ text: "Population" }] },
        { id: "area", header: [{ text: "Land Area (Km²)" }] }
    ],
    group: true,
    data: dataset
});
In the above snippet rows will be grouped by the "country" column values, as the groupable: true property is specified in its configuration.
Configuring data grouping
With the group configuration option set as an object you can display and manage the group panel, adjust rendering of columns, the order of grouping and specify the data aggregation settings. The group configuration object has the properties enumerated below:
panel- (optional) enables the group panel, true by default. When thepanelconfig is set to true, a user can drag columns' headers to the panel of creating and modifying groups
const grid = new dhx.Grid("grid_container", {
    columns: [
        { id: "country", header: [{ text: "Country" }], groupable: true },
        { id: "population", header: [{ text: "Population" }] },
        { id: "area", header: [{ text: "Land Area (Km²)" }] }
    ],
    group: {
        panel: true // enabling the group panel
    },
    data: dataset
});
panelHeight- (optional) defines the height of the group panel in pixels, which allows adjusting the space for rendering a group of columns, 40 by default
const grid = new dhx.Grid("grid_container", {
    columns: [
        { id: "country", header: [{ text: "Country" }], groupable: true },
        { id: "city", header: [{ text: "City" }] },
        { id: "population", header: [{ text: "Population" }] }
    ],
    group: {
        panel: true,
        panelHeight: 60
    },
    data: dataset
});
Related sample: Grid. Grouping customization
hideableColumns- (optional) specifies whether columns will be hidden on a group creation, true by default. If set to false, columns used for grouping will remain visible
const grid = new dhx.Grid("grid_container", {
    columns: [
        { id: "country", header: [{ text: "Country" }], groupable: true },
        { id: "city", header: [{ text: "City" }] },
        { id: "population", header: [{ text: "Population" }] },
    ],
    group: {
        panel: true,
        hideableColumns: false // columns remain visible after grouping
    },
    data: dataset
});
Related sample: Grid. Grouping customization
showMissed- (optional) controls visibility of the elements that don't suit the grouping criteria (e.g. data without values), true by default. The following settings are available:- if set to true, the rows that don't have values for grouping are rendered row by row after all the data
- if a string value is set, e.g. "Missed", the rows that don't have values for grouping are rendered as a separate group the name of which will have the specified string value. This group will be rendered as the last one
- if set to false, the rows that don't suit the grouping criteria won't be rendered
const grid = new dhx.Grid("grid_container", {
    columns: [
        { id: "country", header: [{ text: "Country" }], groupable: true },
        { id: "city", header: [{ text: "City" }], groupable: true },
        { id: "population", header: [{ text: "Population" }] }
    ],
    group: {
        panel: true,
        // elements without values will be rendered as the "Missed" group
        // at the end of the grid data
        showMissed: "Missed"
    },
    data: dataset
});
Related sample: Grid. Grouping missing data
fields- (optional) predefines an extended configuration for data grouping by certain columns, by setting the rules of aggregation and rendering of the results. The attributes of thefieldsobject correspond to the ids of columns for which the aggregation rules and the order of results are being configured. The configuration of a column is defined by theIGroupOrderobject that has the following properties:map- (optional) an object for data aggregation in a group, where the keys are field names, and the values can be:- a tuple
[string, TAggregate]that specifies the field and the aggregation type ("sum", "count", "min", "max", "avg") from thedhx.methodshelper - a user-defined aggregation function
((row: IRow[]) => string | number)
- a tuple
summary- (optional) specifies where the total row is rendered - at thetopor at thebottomof the group
A predefined configuration is needed in cases when the group panel is supposed to be used and the rendered group should have the total row.
const grid = new dhx.Grid("grid_container", {
    columns: [
        { id: "country", header: [{ text: "Country" }] },
        { id: "population", header: [{ text: "Population" }] },
        { id: "density", header: [{ text: "Density (P/Km²)" }] }
    ],
    group: {
        panel: true,
        fields: {
            population: {
                summary: "bottom",
                map: {
                    population: ["population", "sum"],
                    customSummary: function(rows) {
                        return rows.length;
                    }
                }
            }
        },
        order: ["population"]
    },
    groupable: true,
    data: dataset
});
In the above snippet row data is grouped by the values of the "population" column. The "group" column contains:
a) the grouped values of the "population" column and the number of elements that suit the grouping criteria
b) the total rows under the grouped values set by the summary property
Related sample: Grid. Grouping and totals in the summary row
order- (optional) defines the order of grouping by setting the sequence of columns for grouping. The elements of theorderarray can be:- a string that represents a grouping field
- a function
((row: IRow) => string)for dynamic defining of a group - an
IGroupOrderobject that has the following properties:map- (optional) an object for data aggregation in a group, where the keys are field names, and the values can be:- a tuple
[string, TAggregate]that specifies the field and the aggregation type ("sum", "count", "min", "max", "avg") from thedhx.methodshelper - a user-defined aggregation function
((row: IRow[]) => string | number)
- a tuple
summary- (optional) specifies where the total row is rendered - at thetopor at thebottomof the group
Related sample: Grid. Grouping customization
Below you'll find the examples of configuring Grid via the order property:
- You can specify the columns' ids to group data by in the order of their succession. Grouping starts from the first specified column and will continue for each following one:
const grid = new dhx.Grid("grid_container", {
    columns: [
        { id: "country", header: [{ text: "Country" }], groupable: true },
        { id: "city", header: [{ text: "City" }], groupable: true },
        { id: "population", header: [{ text: "Population" }] }
    ],
    group: {
        order: ["country", "city"]
    },
    data: dataset
});
- You can also use callback functions in an array. A callback function takes the current data row and returns the value for grouping:
const grid = new dhx.Grid("grid_container", {
    columns: [
        { id: "country", header: [{ text: "Country" }] },
        { id: "city", header: [{ text: "City" }]},
        { id: "population", header: [{ text: "Population" }] }
    ],
    group: {
        order: [
            (row) => row.population > 1000000
                ? "Large Population"
                : "Small Population"
        ]
    },
    groupable: true,
    data: dataset
});
- You can use a configuration object as an element that defines the grouping order:
const grid = new dhx.Grid("grid_container", {
    columns: [
        {
            id: "country",
            header: [{ text: "Country" }],
            template: (value, row) => {
                // the $groupSummary service property helps defining the resulting row
                if (row.$groupSummary) {
                    return `count: ${row.count}`;
                }
                return value;
            }
        },
        {
            id: "population",
            header: [{ text: "Population" }],
            template: (value, { $groupSummary, ageAvg, populationAvg }) => {
                if (!$groupSummary) return value;
                return `Age avg: ${ageAvg}; Population avg: ${populationAvg}`;
            },
        },
        { id: "city", header: [{ text: "City" }],  },
        { id: "age", header: [{ text: "Age" }] },
    ],
    group: {
        fields: {
            population: {
                summary: "top",
                map: {
                    ageAvg: ["age", "avg"],
                    populationAvg: ["population", "avg"],
                }
            },
        },
        order: [
            {
                by: "country",
                summary: "top",
                map: {
                    count: ["country", "count"]
                }
            },
            "population",
        ],
        hideableColumns: false,
    },
    groupable: true,
    data: dataset
});
- You can also combine columns' ids, functions and configuration objects. Such an approach provides a flexible control over the grouping order by applying static values for some columns and dynamic values calculated by a function for other columns:
const grid = new dhx.Grid("grid_container", {
    columns: [
        { id: "country", header: [{ text: "Country" }] },
        { id: "city", header: [{ text: "City" }],  },
        { id: "population", header: [{ text: "Population" }] },
    ],
    group: {
        order: [
            "country", // grouping by a country
            (row) => row.city[0].toUpperCase() // grouping by the first letter of the city name
        ]
    },
    groupable: true,
    data: dataset
});
column- (optional) defines the configuration of a column that renders values by the grouped data. This column will be used as a main one for structuring and rendering data grouped by value
Related sample: Grid. Grouping customization
You can specify the id of a column in two ways:
- as a string value of the
columnproperty of thegroupobject:
const grid = new dhx.Grid("grid_container", {
    columns: [
        { id: "country", header: [{ text: "Country" }], groupable: true },
        { id: "city", header: [{ text: "City" }], groupable: true },
        { id: "population", header: [{ text: "Population" }] }
    ],
    group: {
        column: "group" // defines the id of a column with grouped data
    },
    data: dataset
});
- as a string value of the
idproperty of thecolumnobject inside thegroupobject
const grid = new dhx.Grid("grid_container", {
    columns: [
        { id: "country", header: [{ text: "Country" }], groupable: true },
        { id: "city", header: [{ text: "City" }], groupable: true },
        { id: "population", header: [{ text: "Population" }] }
    ],
    group: {
        column: {
            id: "group", // defines the id of a column with grouped data
            sortable: false,
            tooltip: false,
        }
    },
    data: dataset
});
Configuration of the column property of the group object
A column with grouped data may contain the following properties in its configuration:
column: {
    id: string | number,
    header: [
        {
            text?: string | ((content: ISummaryList) => string),
            tooltip?: boolean | object, // true by default
            tooltipTemplate?: (
                content: { value: string } & ISummaryList,
                header: IHeader,
                column: ICol
            ) => string | boolean,
            align?: "left" | "center" | "right", // "left" by default
            css?: string,
            headerSort?: boolean, // true by default
            sortAs?: (cellValue: any) => string | number,
            htmlEnable?: boolean, // true by default
        }
    ],
    footer?: [
        {
            text?: string | ((content: ISummaryList) => string),
            tooltip?: boolean | object, // true by default
            tooltipTemplate?: (
                content: { value: string } & ISummaryList,
                header: IHeader,
                column: ICol
            ) => string | boolean,
            align?: "left" | "center" | "right", // "left" by default
            css?: string,
            htmlEnable?: boolean, // true by default
        },
    ],
    align?: "left" | "center" | "right", // "left" by default
    resizable?: boolean, // false by default
    sortable?: boolean, // true by default
    template?: (cellValue: any, row: object, column: object) => string,
    tooltip?: boolean | object, // true by default
    tooltipTemplate?: (cellValue: any, row: object, column: object) => string,
}
Note that the column object of the group configuration option has some properties of a Grid column. You can check the descriptions of the group column object properties enumerated above in the Grid column properties guide.
Making group panel elements closable
You can enable closing of all the elements of the group panel using the closable configuration option of Grid.
const grid = new dhx.Grid("grid_container", {
    columns: [
        { width: 150, id: "country", header: [{ text: "Country" }] },
        { width: 150, id: "population", header: [{ text: "Population" }] },
        { width: 150, id: "density", header: [{ text: "Density (P/Km²)" }] },
        { width: 150, id: "area", header: [{ text: "Land Area (Km²)" }] },
    ],
    group: true,
    groupable: true,
    closable: true,
    data: dataset
});
Related sample: Grid. Grouping customization
You can also use the closable configuration property of a column. It allows making a particular group panel element closable or permanently enabled:
const grid = new dhx.Grid("grid_container", {
    columns: [
        {
            width: 150,
            id: "country",
            header: [{ text: "Country" }],
            // grouping of the "country" column is permanently enabled
            // and can't be switched off via the group panel
            closable: false,
        },
        {
            width: 150,
            id: "population",
            header: [{ text: "Population" }],
            groupable: true,
        },
        { width: 150, id: "density", header: [{ text: "Density (P/Km²)" }] },
        { width: 150, id: "area", header: [{ text: "Land Area (Km²)" }] },
    ],
    group: {
        order: ["country", "population"]
    },
    groupable: true,
    data: dataset
});
Using DataCollection API for data grouping
After you've enabled grouping in Grid, you can use the DataCollection API to work with data grouping.
Grouping Grid data
To group Grid data, use the group() method of DataCollection. The method takes the following parameters:
order- an array that defines the order and configuration for data grouping. Each element in the array can be:- a string that represents a grouping field
- a function
(i: IDataItem) => stringfor dynamic defining of a group - an
IGroupOrderobject that has the following properties:by- the field name or a function for user-defined groupingmap- (optional) an object for data aggregation in a group, where the keys are field names, and the values can be:- a tuple
[string, TAggregate]that specifies the field and the aggregation type ("sum", "count", "min", "max", "avg") from thedhx.methodshelper - a user-defined aggregation function
(i: IDataItem[]) => string | number
- a tuple
summary- (optional) specifies where the total row is rendered - at thetopor at thebottomof the group
config- (optional) the configuration of data groupingshowMissed- (optional) specifies whether the elements that don't have the field for grouping should be displayed, true by default- if set to true, the rows that don't have values for grouping are rendered row by row after all the data
- if a string value is set, e.g. "Missed", the rows that don't have values for grouping are rendered as a separate group the name of which will have the specified string value. This group will be rendered as the last one
- if set to false, the rows that don't suit the grouping criteria won't be rendered
field- (optional) the group field name, "group" by default
There are several examples of grouping Grid data via the group() method of DataCollection:
- simple grouping with the use of a callback function and a string field value
const grid = new dhx.Grid("grid_container", {
    columns: [
        { id: "salary", header: [{ text: "Salary" }] },
        { id: "experience", header: [{ text: "Experience (years)" }] },
        { id: "city", header: [{ text: "City" }] }
    ],
    group: true,
    groupable: true,
    data: dataset
});

grid.data.group([
    function(row) {
        if (row.salary < 30000) return "Low income";
        if (row.salary >= 30000 && row.salary < 70000) return "Medium income";
        return "High income";
    },
    "city"
]);
- grouping with the use of a configuration object and aggregation settings
const grid = new dhx.Grid("grid_container", {
    columns: [
        { id: "department", header: [{ text: "Department" }] },
        { id: "employees", header: [{ text: "Number of Employees" }] },
        { id: "location", header: [{ text: "Location" }] }
    ],
    group: true,
    groupable: true,
    data: dataset
});

grid.data.group([{
    by: "department", // grouping by the `department` field
    map: {
        employees: ["employees", "sum"], // aggregation: sums up the number of employees
        location: (rows) => {
            // a custom function for calculating unique locations
            const uniqueLocations = [...new Set(rows.map(r => r.location))];
            return uniqueLocations.join(", ");
        }
    },
    summary: "top" // the total row is rendered at the top of the group
}]);
Related sample: Grouping and totals in the summary row via data collection
- grouping with the use of the
showMissedproperty
const grid = new dhx.Grid("grid_container", {
    columns: [
        { id: "name", header: [{ text: "Name" }] },
        { id: "age", header: [{ text: "Age" }] },
        { id: "city", header: [{ text: "City" }] }
    ],
    group: true,
    groupable: true,
    data: dataset
});

grid.data.group(["city"], {
    // the group elements that don't have the "city" value
    // will be rendered in the "Unknown City" group
    showMissed: "Unknown City"
});
Related sample: Grid. Grouping missing data
Ungrouping Grid data
To ungroup Grid data, use the ungroup() method of DataCollection.
grid.data.ungroup();
Checking whether Grid data is grouped
To check whether Grid data is grouped at the moment, use the isGrouped() method of DataCollection. The method returns true if Grid data is grouped at the moment and false if it isn't grouped.
if (grid.data.isGrouped()) {
    console.log("The data is currently grouped");
}
Localizing data grouping labels
You can render Grid data grouping labels in the necessary language by translating the related strings and applying a ready locale for the component. The default Grid locale looks like this:
const en = {
    total: "Total", // the name of the total row
    groupText: "Group", // the name of the column with grouped data
    dropAreaTitle: "Group by:", // the name of the area to drop column headers at
    dropAreaPlaceholder: "Drag the column header here", // the placeholder of the dropping area
}
Check the details at the Localization guide.
Controlling scroll behavior
The API of DHTMLX Grid provides the possibility to set scrolls to the necessary position and to get the current state of scrolls.
Scrolling to specific coordinates
You can scroll grid content to exact position defined by x and y coordinates via the scroll() method. Pass the coordinates as parameters of the method.
grid.scroll(75, 230);
Scrolling to specific grid cell
It is also possible to scroll grid content to a particular cell. Pass the ids of the row and the column as parameters:
grid.scrollTo("15", "c");
Related sample: Grid. Controlling scroll behavior
Getting the state of scroll
To return the current state of scroll, use the getScrollState() method.
const state = grid.getScrollState(); // -> {x:0, y:0}
It returns an object with x,y coordinates of a position the grid has been scrolled to.
Repainting Grid
In case you've changed some configuration settings of a grid, you can repaint it on a page via the paint() method:
grid.paint();
Destructing Grid
When it's necessary to release resources occupied by Grid during its activity, you can make use of the destructor() method:
grid.destructor();
Using Selection API
For information on using Selection API, read Work with Selection object.
Using RangeSelection API
For information on using RangeSelection API, read Work with RangeSelection Module.
Using BlockSelection API
For information on using BlockSelection API, read Work with BlockSelection module.
Working with Clipboard
For information on using the Clipboard module in Grid, read Work with Clipboard module.
Working with DragPanel
For information on using the DragPanel module in Grid, read Work with DragPanel module.
Working with History API
For information on using the History API in Grid, read Work with History module.