Chart overview
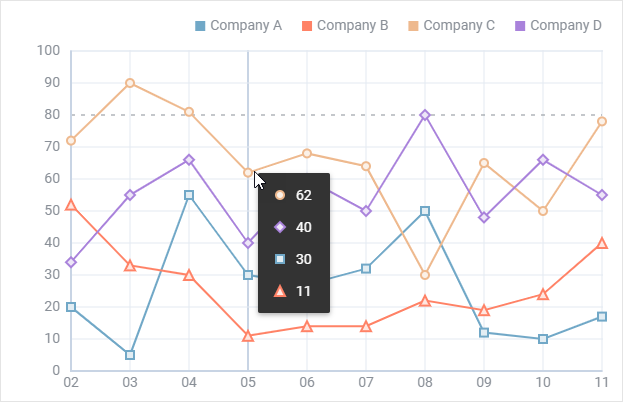
DHTMLX Chart renders interactive charts in web applications. It supports many chart types, displays several data properties on one chart, and adds tooltips. Chart offers both 2D and 3D presentation, several ways to load data, and configuration settings for every chart interface element.
Features
Learn how to build a full-featured DHTMLX Chart:
API reference
Related resources
- To get just DHTMLX Chart, download it from our website
- To get the whole JavaScript library of UI components download DHTMLX Suite
- Try the online samples for DHTMLX Chart
- To work with data of Chart check DataCollection API
Guides
These articles explain how to add Chart to a page and configure it.