Overview of Chart types
DHTMLX Chart provides a variety of charts types that will help you to represent you data in the most suitable way. Each type of chart is easily configurable and can be adjusted according to your preferences. All in all there are 11 types of chart, in the list below they are combined into groups for the sake of convenience:
- Overview of Chart types
Line and Spline chart
This is a basic chart type that shows changes of trends in progress over a period of time. Thus it will help you to display the dynamics of prices over a year or how the number of staff has increased over several years. Choose this variant when your data has more than 10 items.
Line chart
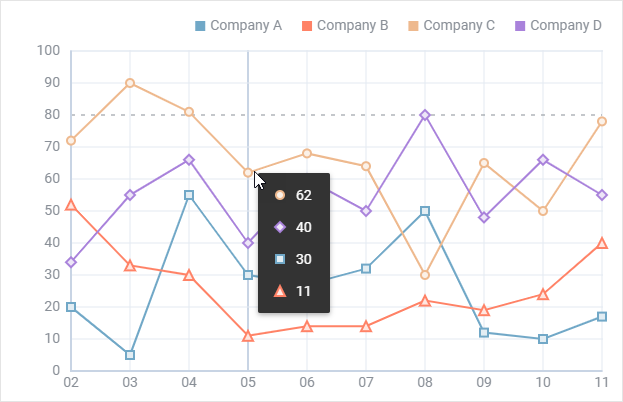
Related sample: Chart. Line chart initialization
Related article: Line and Spline chart configuration
Spline chart
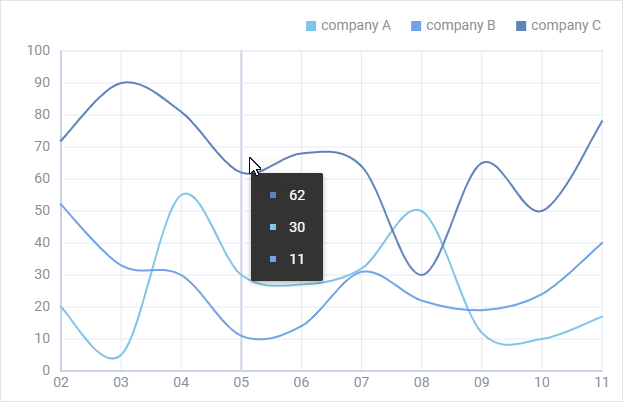
Related sample: Chart. Spline chart initialization
Related article: Line and Spline chart configuration
Bar and X-Bar chart
The same as Line chart it displays data for certain periods. It greatly suits you if there are less than 10 items in your data set.
Bar chart
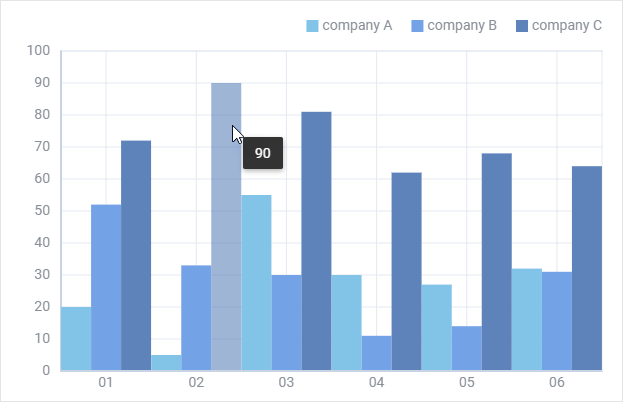
Related sample: Chart. Bar chart initialization
Related article: Bar and X-Bar chart configuration
X-Bar chart
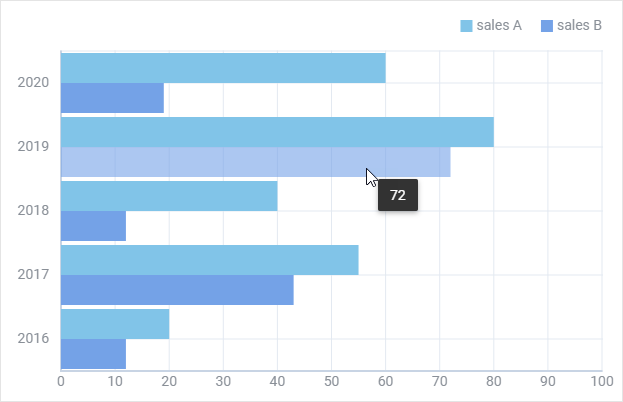
Related sample: Chart. X-Bar chart initialization
Related article: Bar and X-Bar chart configuration
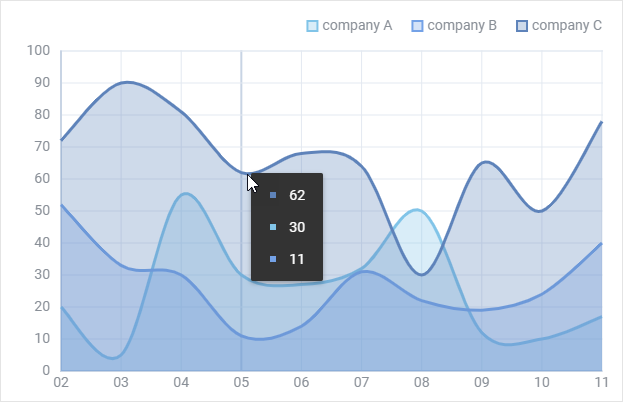
Area and SplineArea chart
Area chart is based on the Line chart. The difference is that areas below lines are filled with color. This type of chart allows you to provide visual comparison of two or more values over time.
Area chart

Related sample: Chart. Area chart initialization
Related article: Area and SplineArea chart configuration
SplineArea chart
Related sample: Chart. Spline Area chart initialization
Related article: Area and SplineArea chart configuration
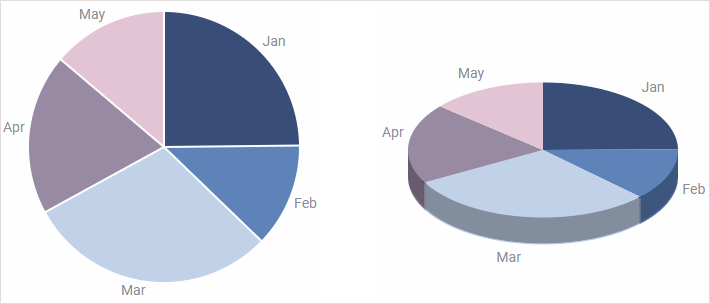
Pie, Pie 3D and Donut chart
Pie chart and its variations are the best choice when you deal with proportions and percentages. It is a circular chart divided into proportional parts that illustrate relations between items in a data set.
Pie and Pie 3D chart
Related sample: Chart. Pie chart initialization
Related sample: Chart. Pie 3D chart initialization
Related article: Pie, Pie 3D and Donut chart configuration
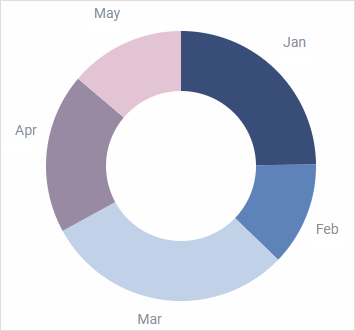
Donut chart
Related sample: Chart. Donut chart initialization
Related article: Pie, Pie 3D and Donut chart configuration
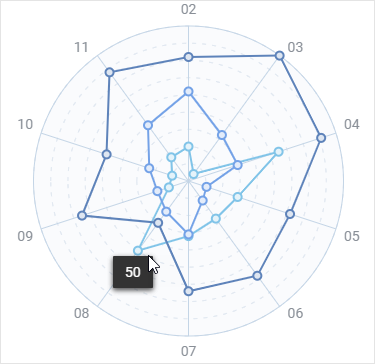
Radar chart
This one is a two-dimensional chart that allows placing one or several series of values over multiple numerical variables. For example, Radar chart will help you to study how a number of parameters relate to one item (the center point of a chart) and compare their values.
Related sample: Chart. Radar chart initialization
Related article: Radar chart configuration
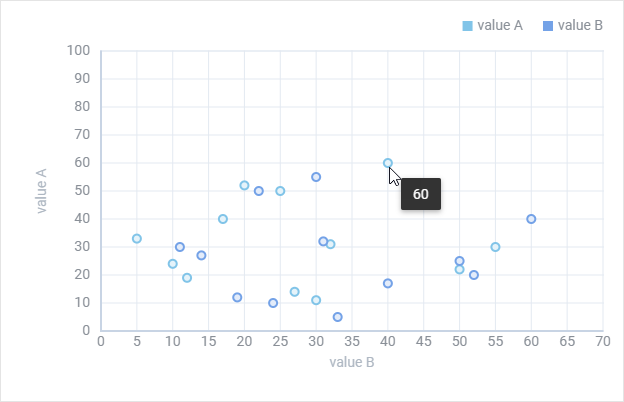
Scatter chart
The peculiarity of Scatter Chart is that it allows exploring relations between two sets of data in order to find out possible dependencies or patterns.
Related sample: Chart. Scatter chart initialization
Related article: Scatter chart configuration
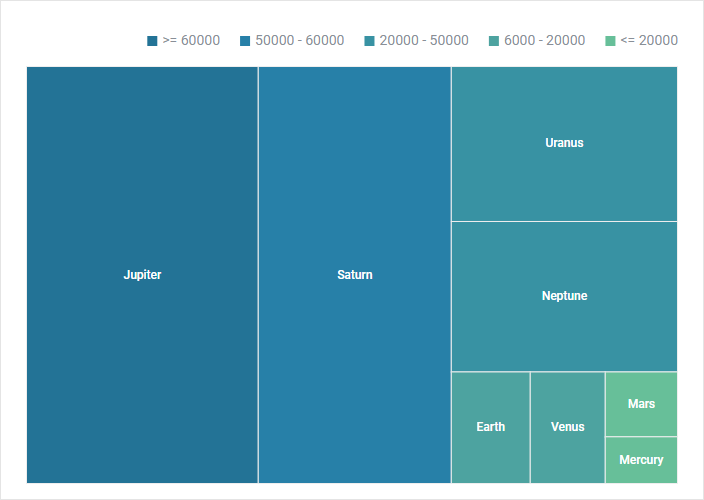
Treemap chart
A treemap chart presents a hierarchical visualization of data as a set of rectangular tiles and makes it easy to spot patterns. Several tiles can be collected into a group. The sizes of tiles are proportional to the values of the data items they represent.
Related sample: Chart. Treemap chart initialization
Related sample: Chart. Treemap chart with groups initialization
Related article: Treemap chart configuration
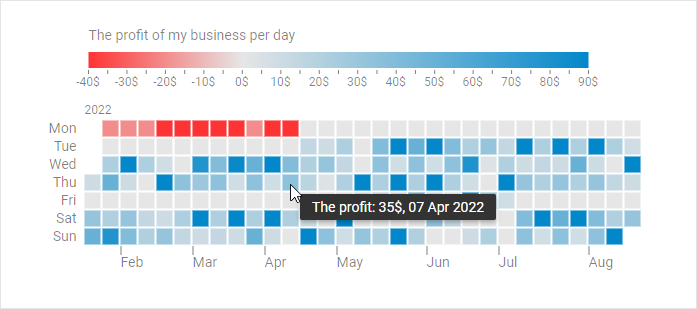
Calendar heatmap chart
The calendar heatmap chart is available only in the PRO version of the DHTMLX Chart (or DHTMLX Suite).
The calendar heatmap chart is a two dimensional calendar view that uses graduated colors to visualize certain number of events for specific days during a year or other specified period of time. The whole time period in the chart is divided into years and years into months. Each cell in a column corresponds to a day of the week.
The chart helps to display and identify daily patterns or anomalies over the necessary period.
Related samples:
- Chart. Calendar heatmap chart initialization
- Gantt. Integration with Suite Calendar heatmap chart
- Event Calendar. Integration with Suite Calendar heatmap chart
- Scheduler. Integration with Suite Calendar heatmap chart
Related article: Calendar heatmap chart configuration