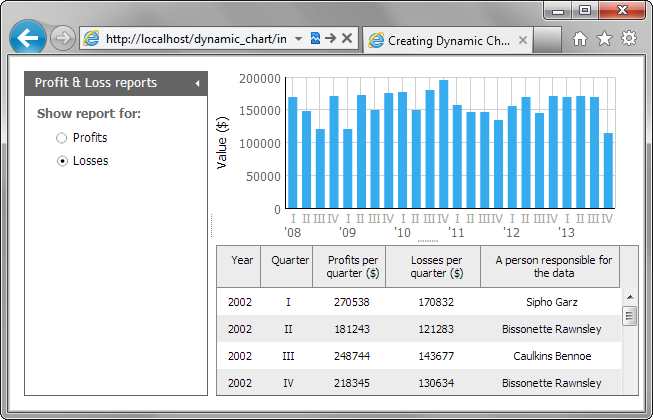
Step 5. Provide switching between 'Profits' and 'Losses'
Now we come to the most interesting part of our tutorial - making the chart dynamic. The first dynamic feature we will add is a possibility to switch between 'Profits' and 'Losses' data.
To provide the possibility we will:
- Add a form with 2 radio buttons: one for profits and one for losses. Once the user clicks a button, the related property is displayed in the chart.
- Use the onChange event of the dhtmlxForm, to detect when the user switches between radio buttons. This event fires each time the values of form's controls are changed. So, it covers all situations when the user can change the data in the form.
- Use the getFormData to get the current values of the form's controls. Note, when we have a group of radio buttons with the same "name" attribute, the method returns the value of the checked radio button in this group.
To provide switching between data properties displayed in the chart:
- Call the attachForm() method to attach a form to the left panel of the layout:
"index.html" file
var form = layout.cells("a").attachForm();
- Create an XML file in the "data " folder and name it, "form.xml ".
- Open the "form.xml " file and specify the "Profits" and "Losses" radio buttons there:
"data/form.xml" file
<?xml version="1.0"?>
<items>
    <item type="settings" position="label-right" offsetLeft="20"
    labelWidth="150"/>
    <item type="block" width="230" offsetLeft="0">
        <item type="label" label="Show report for:" offsetLeft="0"/>
        <item type="radio" name="report_type" value="profits" label="Profits"
        checked="true" />
        <item type="radio" name="report_type" value="losses" label="Losses"/>
    </item>
</items>
- Call the loadStruct() method to load the structure specified in the "form.xml " file to the form:
"index.html" file
var form = layout.cells("a").attachForm();
form.loadStruct("data/form.xml");
- Specify a handler function for the onChange event:
'index.html' file
form.attachEvent("onChange", function (){
    var formValues = form.getFormData();  //gets values of the checked controls
    //variable 'field' specifies the data field that will be displayed in chart
    var field=(formValues.report_type == "profits"?"data2":"data3");
    chart.clearAll();                              //clears the chart from data
    chart.define("value","#"+field+"#");//sets new data property for the Y-Axis
    chart.parse(grid,"dhtmlxgrid");                  //loads data from the grid
    chart.render();                             //renders the chart on the page
});
