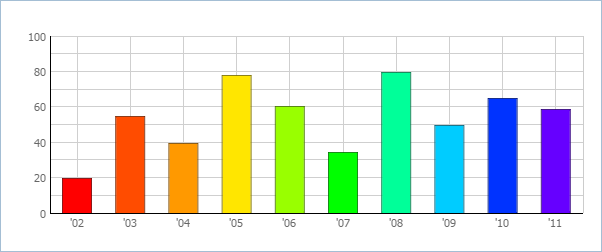
Chart
dhtmlxChart is a powerful tool to create a wide variety of charts for use in web applications. Every feature of the library is carefully created to facilitate your chart creation.
It provides a number of chart types with various sub-types, synchronous representation of several data properties on the same chart, both 2D and 3D presentation, different data sources, interactive actions and tooltips.
dhtmlxChart is completely written in JavaScript and ready to be used in any HTML page.

API reference
Related resources
- You may download dhtmlxChart from dhtmlx.com
- Check online samples for dhtmlxChart
- Don't hesitate to download dhtmlxSuite to get the whole JavaScript library of UI components
Guides
Creating Chart | Gives you a brief summary of dhtmlxChart application. Dwells on Chart initialization and loading data into it. |
Exploring Chart Types | Introduces the available Chart types and peculiarities of their initialization. |
Configuring Chart |
Describes the possibilities of adding extra graphs, coloring charts and gives instructions on configuring particular Chart types. |
Formatting Chart |
Tells about the variants of Chart appearance customization: setting scales, specifying labels, using a legend and showing tooltips. |
Manipulating Chart Elements |
Discusses main actions which can be performed with Chart items and shows the steps of creating Grid-Chart integration. |