Grouping Data Objects
Sometimes the incoming data don't look like we want to display them and need to be processed before displaying in a chart. For example, we've got the sales information over the last years in several companies, and we want to show total sales per company in a chart. So, we need to get objects of the same companies and sum up their sales.
Grouping helps to resolve this problem. It allows gathering objects with the same value of the defined property and creating one object with new properties.
To group data objects, you need to define the 'group' property in the chart constructor or to call the group() method with an object as a parameter.
A group object has two properties:
- by – (string) defines the property that should be used to group data objects,
- map – (object) an object that defines the properties of the grouped objects.
Here is the code for the example described above:
var chart =  new dhtmlXChart({
     view:"bar",
     container:"chart_container",
     value:"#sales#",
     label:"#id#"
});
chart.parse(data,"json");
chart.group({
    by:"#company#",
    map:{
        sales:["#sales#","sum"]
    }
});
or
var chart =  new dhtmlXChart({
    view:"bar",
    container:"chart_container",
    value:"#sales#",
    label:"#id#",
    group:{
        by:"#company#",
        map:{
            sales:["#sales#","sum"]
        }
    }
})
chart.parse(data,"json");
where the incoming data object contains the sales of different companies per year:
var data = [
    { sales:"8.0", year:"2007", company: "company 1"},
    { sales:"7.3", year:"2008", company: "company 1" },
    { sales:"4.8", year:"2009", company: "company 1"},
    ...
    { sales:"5.3", year:"2009", company: "company 4"}
];
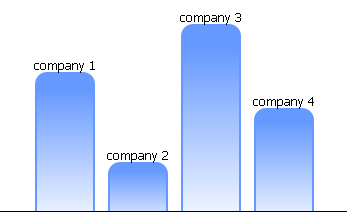
Here data objects are grouped by the "company" property. As a result, we've got new objects. The number of objects is equal to the number of companies. Each new data object has two properties: id (company) and sales (total sales of a certain company):

Properties of the grouped objects are set by the "map" attribute and defined by an array. The first element of this array is a template with a property from original data, the second one – the functor that needs being applied to all values of this property in a group.
Grouping provides the following functors:
- "sum" – all the values are summed up,
- "max" – the maximum value in a group,
- "min" - the minimum value in a group.
It's possible to define a custom functor.
Related sample: Grouping and Sorting
Back to top