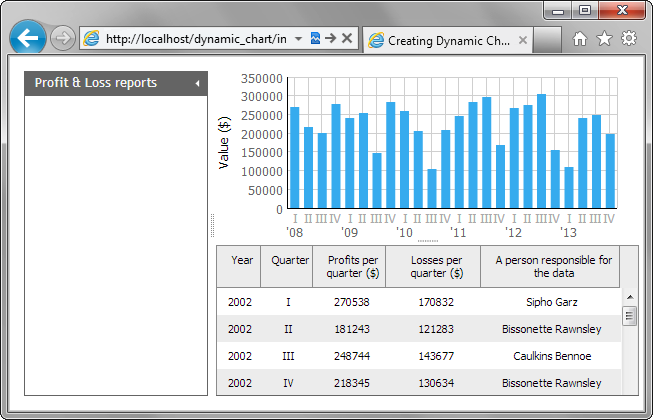
Step 4. Add a Chart
Now, we will add a chart that will represent data that we have specified in the grid. It's going to be a vertical bar chart that will display profits or losses per a specific period. By default, profits.
To create charts on the page, the DHTMLX library provides the dhtmlxChart component.
To add a chart to the layout's cell:
- Call the attachChart() method to add a chart to the cell "b" of the layout:
"index.html"
var chart = layout.cells("b").attachChart({
    view:"bar",                                      //defines the chart's type
    value:"#data2#",                  //data property that the chart represents
    color:"#36abee",                            //the color of the chart's bars
    padding:{left:75, bottom:50, top:50, right:30},//padding of chart's content
    yAxis:{start:0, step:50000, title:"Value ($)"},    //sets the vertical scale
    xAxis:{                                         //sets the horizontal scale
        template:function(obj){return "<span class='quarter'>"+obj.data1+
        "</span>"+(obj.data1=="I"?" '"+obj.data0.substr(2,2):"")}
    },
    preset:"column",                               //applies the styling preset
    border:0                                           //disables bars' borders
});
- Call the parse method to load data from the grid to the chart:
"index.html"
We will call the parse method in the 2nd parameter of the dhtmlxGrid's load method, which is a callback function. We use it to ensure that data will be completely loaded to the grid before we start to populate the chart.//grid.load("data/gridData.xml"); grid.load("data/gridData.xml",function(){ chart.parse(grid,"dhtmlxgrid"); });
In case a chart takes data from a grid, the parse method takes 2 parameters: the dhtmlxGrid object and the value "dhtmlxgrid" (the format for grid's data).
