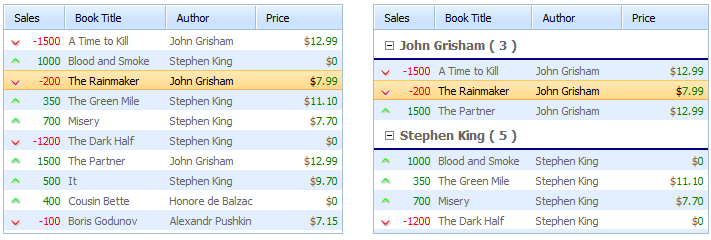
Grouping Data by Rows
In general, dhtmlxGrid displays data on the page without any grouping.
To change dhmlxGrid layout, you can group data by rows or by columns
(read the article Grouping columns).
Grouping can't be used with the Paging and Smart Rendering data loading modes.
Grouping rows will produce the view where rows are filtered by the values of the specified column.

- The group summary rows shows the group key and the count of items in the group by default;
- Grouping doesn't require specific XML formatting;
- You can group/ungroup your grid and change the grouping parameters dynamically;
- If data in the column (the grid was grouped by) is changed, the rows automatically rearrange to fit the group;
- Groups can be expanded/collapsed programatically.
Common technique
Grouping is invoked by a simple command groupBy(col).
- col is the index of a column (zero-based numbering) the grid will be grouped by;
- The method must be invoked only when all data is loaded;
- If the method is called several times with different parameters, data is grouped according to the last one called.
Activating grouping rows in the grid
mygrid = new dhtmlXGridObject('gridbox');
...
mygrid.load("../common/grid.xml",function(){
    mygrid.groupBy(2);// the grid is grouped by the second column
});
To ungroup a grid and bring the standard view back you should call the method unGroup().
Ungrouping the grid
mygrid = new dhtmlXGridObject('gridbox');
...
mygrid.unGroup();
Related sample: Grouping rows by column
Expanding/collapsing a group
There are 4 methods that can be used in the mentioned context:
- expandGroup() - expands a group with the specified key;
- collapseGroup() - collapses a group with the specified key;
- expandAllGroups() - expands all groups;
- collapseAllGroups() - collapses all groups.
mygrid.expandGroup('John Grisham');
mygrid.collapseGroup('Stephen King');
mygrid.expandAllGroups();
mygrid.collapseAllGroups();
Customizing group summary rows (built-in math)
You can customize the presentation of the group summary rows to meet your needs.
There are 2 ways for this:
- To specify the mask of a row. In this case, each cell of the related column can show some aggregate value calculated over all the column values.
- To define a handler function.
Row mask

The mask for the summary rows is set through the second (optional) parameter of the groupBy() method. It's an array, each item of which is mapped to the related column.
Customizing the group summary rows through the row mask
mygrid.groupBy(2,["#stat_max","#title","","#stat_total"]);
The possible aggregate shortcuts:
- title - displayes the group key;
- stat_total - calculates the total of values in a group;
- stat_max - calculates the maximum value in a group;
- stat_min - calculates the minimum value in a group;
- stat_average - calculates the average value in a group;
- stat_count - calculates the count of records in a group;
- #cspan (or empty quotes '') - used to not present anything in a cell (both variants lead to one and the same effect).
Note, the stat-based values are rendered using the same data type that is used in the related column. It allows using the setNumberFormat() method against them (when the source column is of the ron/edn type).
Related sample: Custom group format
Handler function
To customize the group summary rows appearance you can define some handler function and apply it through the customGroupFormat property.
The function takes 2 parameters:
- name - (string) the group key;
- count - (number) the number of rows in the group.

Customizing the group summary rows through a handler function
mygrid.customGroupFormat=function(name,count){
      return name+" :: found " +count+ " records";
}
mygrid.groupBy(2);
Related sample: Custom group format
Using aggregate shortcuts in the handler function
Note, you can use the aggregation shortcuts in your handler function as well (see the list of such shortcuts in the chapter above). To use the shortcuts in the function, you should call the groupStat method that returns the result of aggregation for a column and accepts the following parameters:
- key - the group key;
- ind - the column index (zero-based numbering);
- item - the aggregation shortcut.
.png)
Using aggregate shortcuts in the handler function
mygrid.customGroupFormat=function(name,count){
    return name
    +", Max sales="
    +grid.groupStat(name,3,"stat_max")
    +", total="
    +grid.groupStat(name,3,"stat_total");
}
mygrid.groupBy(2);
Related sample: Custom group format
Group iterator
The library provides a built-in iterator that can be used to iterate through all rows in some group and calculate a custom math.
Using iterator for a group
mygrid.forEachRowInGroup(name,function(id){
       do_something_with_row(id);
});
where name is the group key (e.g. 'John Grisham').
Back to top