스케일 설정

스케일의 구성은 scales 속성을 통해 지정됩니다. 배열의 scales 구성에 스케일 객체를 설정하여 원하는 만큼의 스케일을 정의할 수 있습니다:
// 단일 일(day) 스케일
gantt.config.scales = [
	{ unit: "day", step: 1, format: "%j, %D" }
];

// 여러 스케일을 한 번에 설정
gantt.config.scales = [
	{ unit: "month", step: 1, format: "%F, %Y" },
	{ unit: "week", step: 1, format: weekScaleTemplate },
	{ unit: "day", step: 1, format: "%D", css: daysStyle }
];
다음과 같은 시간 축(X-축)의 측면을 구성할 수 있습니다:
또한 맞춤 스케일을 추가할 수 있습니다.
시간 단위
스케일의 단위를 설정하려면 해당 스케일 객체의 unit 속성을 사용합니다:
가능한 값은: "minute", "hour", "day" (기본값), "week", "quarter", "month", "year".
gantt.config.scales = [
	{ unit: "month", step: 1, format: "%F, %Y" },
	{ unit: "day", step: 1, format: "%j, %D" }
];

gantt.init("gantt_here");
범위
기본 범위 설정
날짜 범위를 명시적으로 지정하지 않으면, Gantt는 로드된 작업의 날짜를 사용하고 스케일에서 첫 작업 이전과 마지막 작업 이후에 오프셋을 추가합니다. 이 오프셋은 시간 축의 설정에 의해 정의됩니다. scale_offset_minimal 값에 따라, scales 옵션의 unit 속성으로 정의된 시간 단위이거나 가장 작은 시간 축 단위를 기준으로 결정됩니다.
표시되는 날짜 범위는 getState 메서드를 사용해 프로그래밍 방식으로 얻을 수 있습니다.
const state = gantt.getState();

console.log(state.min_date);
// -> Mon Jan 01 2025 00:00:00

console.log(state.max_date);
// -> Tue Jan 01 2026 00:00:00
스케일 범위는 gantt rendering 시 재계산됩니다. 사용자가 표시된 시간 범위를 벗어나 작업을 이동하면 작업 행은 표시되지만 바(bar) 요소는 전체 재페인트가 완료될 때까지 보이지 않습니다.
스케일을 자동으로 조정하려면 fit_tasks 구성을 사용하세요.
gantt.config.fit_tasks = true;
gantt.init("gantt_here");
날짜 범위를 명시적으로 설정
대신 start_date 및 end_date 구성 옵션을 사용해 날짜 범위를 명시적으로 설정할 수 있습니다:
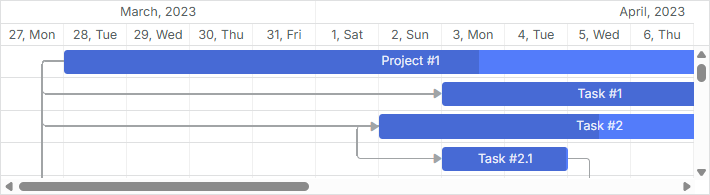
gantt.config.start_date = new Date(2025, 02, 31);
gantt.config.end_date = new Date(2025, 03, 09);

gantt.init("gantt_here");
또는 gantt 초기화 호출에서 지정할 수도 있습니다:
gantt.init("gantt_here", new Date(2025, 02, 31), new Date(2025, 03, 09));
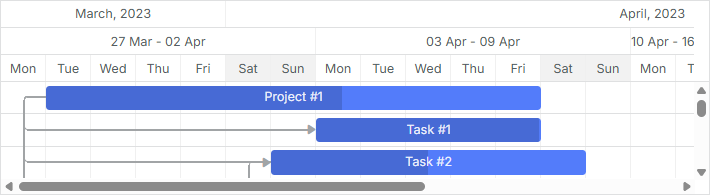
지정된 간격에 맞지 않는 작업은 [unscheduled]로 표시되거나 표시되지 않고 간트 차트에 표시되지 않습니다.
참고
둘 다 start_date 및 end_date 옵션이 지정되고 범위 밖에 있는 작업을 생성하면 차트에서 해당 작업이 사라집니다. 차트에 작업을 표시하려면 [tasks outside timescale] 가이드의 예시를 참고하거나 show_tasks_outside_timescale 구성을 사용하십시오.
gantt.config.start_date = new Date(2025, 02, 31);
gantt.config.end_date = new Date(2025, 03, 09);
gantt.config.show_tasks_outside_timescale = true;

gantt.init("gantt_here");
범위를 강제로 확장하려면 위의 구성을 사용하지 않는 경우에도 다음과 같은 로직으로 확장할 수 있습니다:
gantt.attachEvent("onLightboxSave", (id, task, is_new) => {
	const { start_date: taskStart, end_date: taskEnd } = task;
	const { start_date: scaleStart, end_date: scaleEnd } = gantt.config;

	// 현재 Timescale 범위를 벗어난 작업인 경우
	if (scaleStart > taskEnd || scaleEnd < taskStart) {
		// Timescale 범위를 업데이트
		gantt.config.end_date = new Date(
			Math.max(taskEnd.valueOf(), scaleEnd.valueOf())
		);

		gantt.config.start_date = new Date(
			Math.min(taskStart.valueOf(), scaleStart.valueOf())
		);

		gantt.render();
	}

	return true;
});
또는 라이트박스 컨트롤에 유효성 검사를 추가할 수 있습니다:
gantt.attachEvent("onLightboxSave", (id, task, is_new) => {
	const { start_date: taskStart, end_date: taskEnd } = task;
	const { start_date: scaleStart, end_date: scaleEnd } = gantt.config;

	// 작업이 범위를 벗어났는지 확인
	if (scaleStart > taskEnd || scaleEnd < taskStart) {
		gantt.message({
			type: "warning",
			text: "Warning! The task is outside the date range!",
			expire: 5000
		});

		return false;
	}

	return true;
});
표시 범위를 동적으로 변경
실시간으로 표시 범위를 변경하는 방법은 여러 가지가 있습니다:
- 로드된 작업을 표시되도록 동적으로 조정하면서 start_date / end_date 구성을 사용해 시간 범위를 제어할 수 있습니다.
이를 스케일 범위를 재계산하여 gantt가 다시 도려질 때마다 start_date / end_date 구성을 업데이트하는 방식으로도 할 수 있습니다:
gantt.attachEvent("onBeforeGanttRender", () => {
	const range = gantt.getSubtaskDates();
	const scaleUnit = gantt.getState().scale_unit;

	if (range.start_date && range.end_date) {
		gantt.config.start_date = gantt.calculateEndDate(
			range.start_date, -4, scaleUnit
		);

		gantt.config.end_date = gantt.calculateEndDate(
			range.end_date, 5, scaleUnit
		);
	}
});

gantt.init("gantt_here");
- 로케일에서 스케일 간격에 맞지 않는 작업이 있을 때마다 스케일 재렌더링을 강제하려면 fit_tasks 속성을 true로 설정하십시오:
gantt.config.fit_tasks = true;
gantt.init("gantt_here");
두 옵션 중 하나를 사용해도 될 때, start_date 와 end_date 옵션이 모두 지정된 경우에는 위의 note에서 설명한 방법 중 하나를 사용해야만 fit_tasks가 올바르게 작동합니다.
- 또한 작업을 드래그하는 동안 스케일을 자동으로 변경하도록 하려면 onTaskDrag 이벤트 핸들러 안에 필요한 로직을 넣을 수 있습니다:
gantt.attachEvent("onTaskDrag", (id, mode, task, original) => {
	const state = gantt.getState();
	const minDate = state.min_date;
	const maxDate = state.max_date;

	const scaleStep = gantt.date.add(
		new Date(), state.scale_step, state.scale_unit
	) - new Date();

	let showDate;
	let repaint = false;

	if (mode == "resize" || mode == "move") {
		if (Math.abs(task.start_date - minDate) < scaleStep) {
			showDate = task.start_date;
			repaint = true;
		} else if (Math.abs(task.end_date - maxDate) < scaleStep) {
			showDate = task.end_date;
			repaint = true;
		}

		if (repaint) {
			gantt.render();
			gantt.showDate(showDate);
		}
	}
});
관련 샘플 Re-rendering Scale during Task Dragging
명시적 날짜 범위를 벗어난 작업 표시
지정된 날짜 범위에 맞지 않는 작업을 간트 차트에 표시하는 것이 가능합니다.
이를 위해 show_tasks_outside_timescale 구성 매개변수를 true로 설정하면 됩니다:
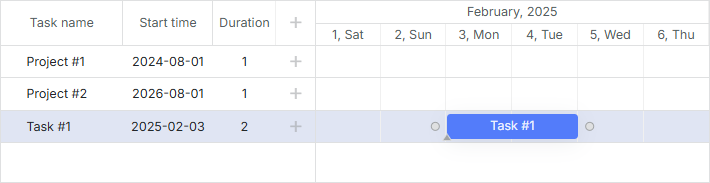
const data = {
	tasks: [
		{ id: 1, text: "Project #1", start_date: "01-09-2024", end_date: "02-09-2024" },
		{ id: 2, text: "Project #2", start_date: "01-09-2026", end_date: "02-09-2026" },
		{ id: 3, text: "Task #1", start_date: "03-02-2025", end_date: "05-02-2025" }
	],
	links: []
};

gantt.config.show_tasks_outside_timescale = true;

gantt.init("gantt_here", new Date(2025, 1, 1), new Date(2025, 1, 7));
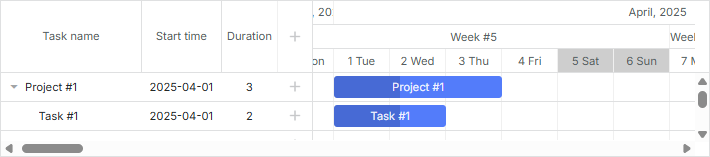
그 결과 ID가 "1" 및 "2"인 작업은 타임라인 영역의 빈 행으로 페이지에 표시되며 격자에는 지정된 이름과 시작 날짜가 표시됩니다.
시간 간격

시간 축의 간격을 설정하려�면 해당 스케일 객체의 step 속성을 사용합니다:
const monthScaleTemplate = (date) => {
	const dateToStr = gantt.date.date_to_str("%M");
	const endDate = gantt.date.add(date, 2, "month");

	return `${dateToStr(date)} - ${dateToStr(endDate)}`;
};

gantt.config.scales = [
	{ unit: "year", step: 1, format: "%Y" },
	{ unit: "month", step: 3, format: monthScaleTemplate },
	{ unit: "month", step: 1, format: "%M" }
];

gantt.init("gantt_here");
높이
스케일의 높이를 설정하려면 scale_height 속성을 사용하십시오:
gantt.config.scale_height = 54; /*!*/

gantt.init("gantt_here");
스케일이 여러 개인 경우 각 스케일은 지정된 높이를 동일하게 공유합니다. 예를 들어, scale_height가 60픽셀이고 스케일이 3개라면 각 스케일의 높이는 60 / 3 = 20 픽셀이 됩니다.
날짜 형식
사용 가능한 형식 문자에 대해 알아보려면 Date Format Specification 문서를 참조하세요.
스케일의 형식을 설정하려면 해당 스케일 객체의 format 속성을 사용합니다. 날짜 형식은 문자열로 설정할 수 있습니다:
gantt.config.scales = [
	{ unit: "month", step: 1, format: "%F, %Y" },
	{ unit: "week", step: 1, format: weekScaleTemplate },
	{ unit: "day", step: 1, format: "%D", css: daysStyle }
];

gantt.init("gantt_here");
또는 date 객체를 매개변수로 받는 함수로도 설정할 수 있습니다:
gantt.config.scales = [
	{ unit: "day", step: 1, format: (date) => {
		return `<strong>Day ${dayNumber(date)}</strong><br/>${dateFormat(date)}`;
	}}
];

스타일링
시간 축의 셀을 스타일링하려면 해당 스케일 객체의 css 속성을 사용하십시오.
function getWeekOfMonthNumber(date) {
	let adjustedDate = date.getDate() + date.getDay();
	let prefixes = ['0', '1', '2', '3', '4', '5'];
	return (parseInt(prefixes[0 | adjustedDate / 7]) + 1);
}

gantt.config.scales = [
	{ unit: "month", step: 1, format: "%F, %Y" },
	{ unit: "week", step: 1, format: (date) => {
		return "Week #" + getWeekOfMonthNumber(date);
	}},
	{ unit: "day", step: 1, format: "%j %D", css: (date) => {
		if (!gantt.isWorkTime(date)) {
			return "week-end";
		}
	}}
];
관련 샘플 Styling of cells of the time scale
스케일 구성을 위한 설정에서 css 속성이 지정되지 않은 경우, scale_cell_class 템플릿을 정의하여 scales 구성 배열의 첫 번째 시간 축에 CSS 클래스를 적용할 수 있습니다.
gantt.config.scales = [
	{ unit: "day", step: 1, format: "%d" },
	{ unit: "day", step: 1, format: "%D" },
	{ unit: "hour", step: 1, format: "%H" }
];

gantt.templates.scale_cell_class = date => gantt.isWorkTime(date) ? "" : "week_end";
관련 샘플 Styling of the first time scale
시간 축의 모든 스케일에 대해 scale_cell_class 템플릿을 적용하려면 inherit_scale_class 속성을 true로 설정하십시오.
gantt.config.inherit_scale_class = true; /*!*/
관련 샘플 Styling of all scales
또한 work time calculations을 사용할 때 하드코딩된 값 대신 isWorkTime를 사용할 수 있습니다:
gantt.config.work_time = true;
gantt.templates.scale_cell_class = date => gantt.isWorkTime(date) ? "" : "week_end";
타임라인 영역에 맞춤 스타일을 적용하는 방법에 대한 자세한 내용은 Highlighting Time Slots 문서를 참고하십시오.
맞춤 시간 단위
dhtmlxGantt는 사용자 정의 시간 단위를 정의하고 스케일 구성에서 레이블 템플릿을 설정할 수 있게 해줍니다.
사용자 정의 단위를 정의하려면 Date 객체에 2개의 함수를 정의해야 합니다:
Date gantt.date.<unit>_start(Date date);
Date gantt.date.add_<unit>(Date date, Integer increment);
- 첫 번째 함수는 주어진 날짜의 시작 시간을 반환해야 합니다(예: 14일 2월의 month_start는 1일 2월이 됨).
- 두 번째 함수는 주어진 기간 단위의 숫자만큼 날짜를 증가시킵니다(예: '날짜에서 2일 빼기')
일반적으로 증가분은 양수 값이지만 스케일의 셀은 왼쪽에서 오른쪽으로 생성되기 때문에 첫 셀의 생성은 오른쪽에서 왼쪽으로 구현되며, 따라서 증가분의 음수 값을 사용합니다.
예제 1
"연 fiscal_year" 단위를 만들고 연도가 1월 31일에 종료된다고 가정해 봅시다. 이 새 단위는 아래와 같이 정의할 수 있습니다:
const firstMonth = 1;
const firstDay = 1;

gantt.date.fiscal_year_start = date => {
	let next = new Date(date);

	if (next.getMonth() < firstMonth ||
		(next.getMonth() === firstMonth && next.getDate() < firstDay)) {
		next = gantt.date.add(next, -1, "year");
	}

	next = gantt.date.year_start(next);
	next.setMonth(firstMonth);
	next.setDate(firstDay);

	return next;
};

gantt.date.add_fiscal_year = (date, inc) => gantt.date.add(date, inc, "year");
그리고 이를 코드에서 다음과 같이 사용합니다:
const dateToStr = gantt.date.date_to_str("%Y");

const fiscalYearLabel = date => dateToStr(gantt.date.fiscal_year_start(date));

gantt.config.scales = [
    { unit: "year", step: 1, format: "Calendar year %Y" },
    { unit: "fiscal_year", step: 1, format: fiscalYearLabel },
    { unit: "month", step: 1, format: "%M %Y" },
    { unit: "day", step: 1, format: "%d %M" }
];
예제 2
각 "일" 셀을 3개의 "시간" 셀로 나누고 00, 08, 16 라벨을 붙일 수 있습니다. 로직은 다음과 같습니다:
gantt.date.hour_custom_start = date => date;

gantt.date.add_hour_custom = (date, inc) => { // inc는 "step"에 따라 달라짐
    const nextDate = new Date(date);

    if (nextDate.getHours() % 8 !== 0) { // 시각 값이 0, 8, 16이 아님 /*!*/
        const diff = Math.abs(8 - nextDate.getHours()); /*!*/
        return gantt.date.add(nextDate, diff * inc, "hour"); /*!*/
    } /*!*/

    return gantt.date.add(date, 8 * inc, "hour"); /*!*/
};

gantt.config.scales = [
    { unit: "day", step: 1, date: "%d %F" },
    { unit: "hour_custom", step: 1, date: "%H" }
];

gantt.config.date_grid = "%Y-%m-%d %H:%i";
관련 샘플 Custom hours on the scale
먼저 Gantt가 첫 번째 "시간" 셀을 생성하는 방식을 살펴보겠습니다. 예제에서 보듯 가장 이른 작업은 07:00에 시작합니다. 하지만 7은 8의 배수가 아니므로 Gantt는 다음 규칙을 따릅니다:
if (nextDate.getHours() % 8 != 0) {
	const diff = Math.abs(8 - nextDate.getHours());  // 8 - 7 = 1
	return gantt.date.add(nextDate, diff * inc, "hour"); // 7 - 1 = 6
}
- Gantt는 8:00과 7:00 사이의 시간 간격을 계산합니다:
diff = 08:00 - 07:00 = 1시간
- 그 다음, 간격과 증가분의 곱을 구합니다:
diff * inc = 1 hour * (-1) = -1 hour
증가분의 음수 값은 스케일의 셀을 왼쪽에서 오른쪽으로 생성하기 때문입니다.
- 마지막으로, 가장 이른 작업의 시간에 얻은 값을 더합니다:
07:00 + (- 1 hour) = 06:00
첫 번째 셀의 값은 06입니다.
두 번째 "시간" 셀을 만들려면 같은 로직을 따르되 증가분을 양수로 사용합니다:
-
diff = 08:00 - 06:00 = 2 hours
-
diff * inc = 2 hour * 1 = 2 hours
-
06:00 + 2 hours = 08:00
두 번째 셀의 값은 08 이고, 이제 8은 8의 배수이므로 다음 셀의 값은 08:00 + 8 hours = 16:00 이고, 이후 셀들에 대해서도 같은 방식으로 반복됩니다.
이 로직은 명시적으로 날짜 범위를 지정하지 않기 때문에 작동합니다.
자세한 샘플은 How to add a custom scale 문서를 확인하세요.
맞춤 시간 구간
다음은 시간 축을 커스터마이즈하고 구성하는 예제로, 비작동 시간 구간을 표시하거나 비작동 시간이 시작 부분에서 스케일 셀로 숨겨지는 방법을 보여줍니다. 아래 예는 근무 시간이 08:00-12:00, 13:00-17:00인 경우의 일반적인 맞춤 스케일 예시를 제공합니다.
gantt.plugins({
	auto_scheduling: true,
});

gantt.config.work_time = true;
gantt.config.correct_work_time = true;
gantt.config.duration_unit = "minute";
gantt.config.duration_step = 1;
gantt.config.time_step = 1;
gantt.config.round_dnd_dates = false;

gantt.setWorkTime({ hours: ["8:00-12:00", "13:00-17:00"] }); /*!*/

gantt.date.day_custom_start = date => date; /*!*/

gantt.date.add_day_custom = (date, inc) => { /*!*/
	const nextDate = new Date(date); /*!*/

	if (nextDate.getHours() < 8) { /*!*/ // Statement 1
		const diff = 8 - nextDate.getHours(); /*!*/
		return gantt.date.add(nextDate, diff * inc, "hour"); /*!*/
	} /*!*/

	if (nextDate.getHours() === 8) { /*!*/ // Statement 2
		return gantt.date.add(nextDate, 9 * inc, "hour"); /*!*/
	} /*!*/

	if (nextDate.getHours() === 17) { /*!*/ // Statement 3
		return gantt.date.add(nextDate, 15 * inc, "hour"); /*!*/
	} /*!*/

	return gantt.date.add(date, 8 * inc, "hour"); /*!*/
}; /*!*/

gantt.config.scales = [
	{ unit: "day_custom", step: 1, date: "%d %H:00" },
];
관련 샘플 Custom time spans
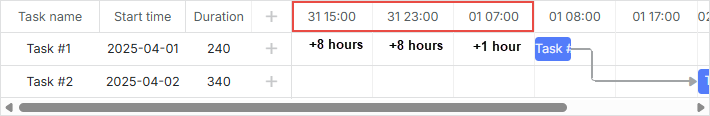
생략: 가장 이른 작업이 2025년 4월 1일 08:00에 시작한다고 가정하고, gantt.config.skip_off_time의 값에 따라 이 작업 이전에 오프셋이 어떻게 더해지는지 살펴봅니다.
처음에는 시간 축에서 비근무 시간을 숨기는 구성으로 시작합니다:
gantt.config.skip_off_time = true;
이 경우 첫 번째 "시간" 셀을 만들기 위해 Gantt는 가장 이른 작업의 시간을 이전 날짜의 근무 시간으로 맞추기 위해 08:00에 대해 시각을 감소시킵니다.
- 처음에 2025년 4월 1일 08:00에서 9시간을 빼서:
08:00 - 9 hours = 23:00
- 23:00은 비근무 시간으로 어떤 조건도 만족하지 않으므로 8시간을 더 빼서 시점을 다시 감소시킵니다:
23:00 - 8 hours = 15:00
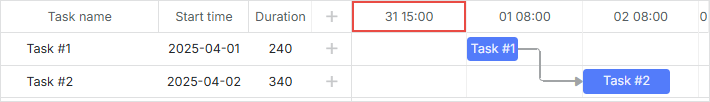
- 그 결과의 시간인 2025년 3월 31일 15:00은 근무 시간으로 간주됩니다. 따라서 첫 번째 셀의 값은 31 15:00이 됩니다.
다음 셀의 값을 계산하는 방법은 아래와 같이 이해합니다. 이제 [gantt.config.skip_off_time]을 비활성화해 보겠습니다:
gantt.config.skip_off_time = false;
위에서 본 바와 같이 시간 축의 첫 번째 셀은 값이 31 15:00가 됩니다. 그러나 가장 이른 작업 이전의 빈 셀 수는 증가합니다. 비근무 시간이 스케일에 함께 표시되기 때문입니다.
이들 셀의 값을 계산하는 로직은 다음과 같이 적용됩니다:
- 2025년 3월 31일 15:00은 근무 시간으로 간주되며 어떠한 조건에도 해당하지 않는 경우입니다. 따라서 두 번째 셀의 값을 계산하기 위해 8시간을 더합니다:
15:00 + 8 hours = 23:00
- 2025년 3월 31일 23:00은 비근무 시간이므로 역시 조건에 부합하지 않습니다. 따라서 세 번째 셀의 값도 같은 방식으로 계산됩니다:
23:00 + 8 hours = 7:00
-
2025년 4월 1일 7:00은 비근무 시간으로 8:00 미만이므로(Statement 3) 다음 셀의 값은 아래와 같이 계산합니다:
- diff = 08:00 - 07:00 = 1 hour
- diff * inc = 1 hour * 1 = 1 hour
- 07:00 + 1 hour = 08:00
따라서 04월 01일 08:00 은 가장 이른 작업의 시작 시점이 됩니다.
다른 모든 셀도 이와 비슷한 방식으로 생성됩니다.
보시다시피, skip_off_time 속성을 비활성화하면 가장 이른 날짜를 가진 작업 앞에 하나보다 더 많은 빈 셀을 추가할 수 있습니다. 속성이 활성화되었는지 여부와 상관없이 항상 한 개의 셀만 생성되길 원한다면 아래 로직을 적용할 수 있습니다:
gantt.date.add_day_custom = (date, inc) => {
	// 작업 시간이 활성화되고 작업이 로드된 경우,
	// 첫 번째 셀의 날짜를 계산합니다.
	// 최소 날짜에서 오른쪽에서 왼쪽으로 이동하고
	// 근무 시간 내에서 가장 가까운 날짜를 찾고
	// 이 날짜에서 1시간을 뺍니다
	if (inc < 0 && gantt.getTaskByTime().length) {
		return gantt.calculateEndDate({
			start_date: date, duration: -1, unit: gantt.config._duration_unit
		});
	}

	// 근무 시간의 시작(근무일)
	// 근무일의 종료 시간을 계산합니다
	if (date.getHours() === 8) {
		return gantt.calculateEndDate(date, 8);
	}

	// 근무 시간의 끝(근무일)
	// 다음 근무일의 시작 시점을 계산합니다
	if (date.getHours() === 17) {
		return gantt.date.add(date, 15 * inc, "hour");
	}

	// 작업이 로드되었을 때 스케일의 두 번째 셀의 근무 날짜를 계산
	// 작업이 없으면 모든 스케일 셀의 날짜를 계산
	date = gantt.date.add(date, 1 * inc, "day");
	gantt.date.day_start(date);
	date = gantt.getClosestWorkTime({ date, dir: "future" });

	return date;
};

gantt.config.scales = [
	{ unit: "day_custom", step: 1, date: "%d %H:%i" },
];

gantt.config.work_time = true;
gantt.config.skip_off_time = false; /*!*/
관련 샘플 Equal offset for custom scales
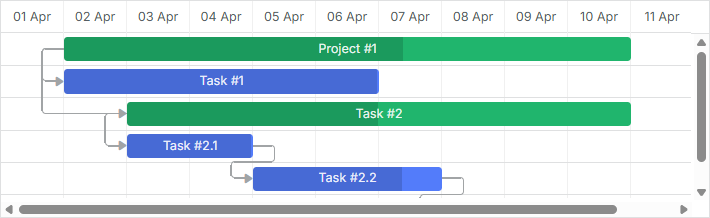
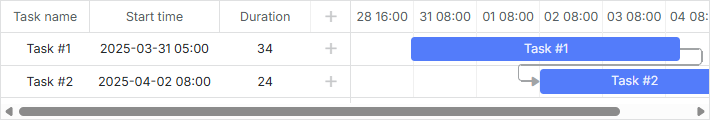
다음은 비근무 시간이 숨겨진 모드에서 스케일의 모양입니다:
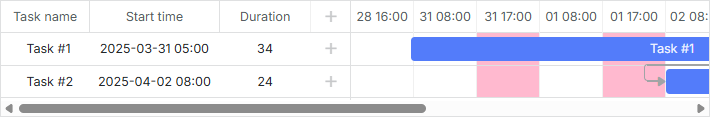
그리고 비워진 시간이 보이도록 하는 경우의 모습은 다음과 같습니다(gantt.config.skip_off_time 이 비활성화된 경우):
무한 스크롤
타임라인에서 무한 스크롤을 구현하는 방법에 대한 자세한 예제는 관련 문서의 기사에서 확인할 수 있습니다. How-to 문서의 관련 섹션을 참고하십시오.
고정된 라벨
버전 9.0부터 시간 축 라벨은 기본적으로 스티키로 표시됩니다. 이는 셀의 너비가 라벨의 너비보다 훨씬 클 때도 스크롤 시 라벨이 보이고 뷰포트에 따라 고정되어 남아 가시성을 높여줍니다. 라벨이 셀 안에서 가운데 정렬되도록 하고 스크롤 중에도 보이지 않길 원하면, 스케일 객체의 sticky 속성을 false로 설정해 이전 동작으로 되돌릴 수 있습니다:
gantt.config.scales = [
	{ unit: "year", step: 1, format: "%Y", sticky: false },
	{ unit: "month", step: 1, format: "%F", sticky: false },
	{ unit: "day", step: 1, format: "%j", sticky: false }
];

gantt.init("gantt_here");
특정 스케일에 대해 셀 너비와 상관없이 항상 스티키 라벨을 적용하려면 sticky: true를 설정할 수 있습니다. 이렇게 하면 라벨 너비가 셀 너비보다 작아도 항상 스티키 상태를 유지합니다:
gantt.config.scales = [
	{ unit: "year", step: 1, format: "%Y", sticky: true },
	{ unit: "month", step: 1, format: "%F", sticky: true },
	{ unit: "day", step: 1, format: "%j", sticky: true }
];

gantt.init("gantt_here");
고정 열 너비
기본적으로 타임라인 열의 너비는 유연하게 조정됩니다. 컨테이너의 너비를 채우도록 확장되거나, 수평 스크롤이 나타날 때까지 min_column_width 값으로 줄어듭니다.
가장 아래 위치한 스케일의 열 너비를 고정값으로 잠그려면 스케일 객체에서 column_width 속성을 설정합니다:
gantt.config.scales = [
	{ unit: "year", step: 1, format: "%Y" },
	{ unit: "month", step: 1, format: "%F" },
	{ unit: "day", step: 1, format: "%j", column_width: 60 } /*!*/
];

gantt.init("gantt_here");
이 설정이 지정되면 아래 예의 마지막 스케일(위 예의 "day")의 각 셀은 정확히 60px 너비가 됩니다. 렌더링되는 열의 수에 관계없이:
- 컨테이너를 채우기에 열이 충분하지 않으면 남는 공간은 오른쪽에 비어 있게 남습니다.
- 열이 너무 많으면 수평 스크롤바가 나타납니다.
column_width는 gantt.config.scales의 맨 아래 스케일 항목에만 적용되며, 상위 수준에 설정해도 효과가 없습니다.
또한 column_width가 설정되면 하단 스케일에 대해서는 gantt.config.min_column_width가 적용되지 않습니다.
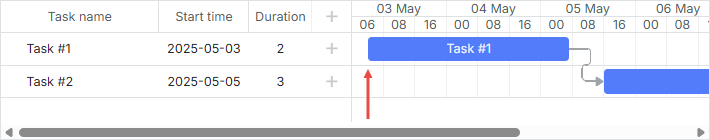
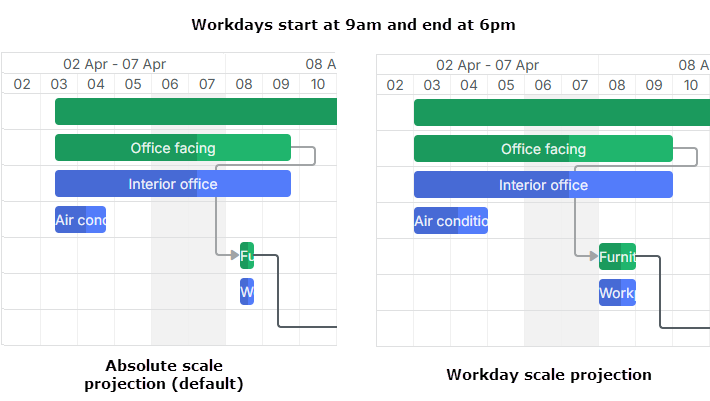
Day/Week 스케일에서 근무 시간 인식 작업 막대 렌더링
스케일 셀의 가장자리에 위치시키고 크기를 조정하여 근무 시간에 맞춘 작업 막대의 위치와 크기를 설정하려면 스케일 투사(scale projection) 기능을 사용하십시오. 이렇게 하면 전체 근무일을 채우는 작업(예: 09:00-17:00)이 해당 하루 셀 전체를 채워 가독성을 높여줍니다.
투사 모드를 설정하려면 아래 맨 아래에 위치한 스케일 객체의 projection 속성을 사용합니다:
gantt.config.scales = [
	{unit: "month", step: 1, format:"%M %Y"},
	{unit: "week", step: 1, format: function (date) {
		const dateToStr = gantt.date.date_to_str("%d %M");
		const endDate = gantt.date.add(date, 7 - date.getDay(), "day");
		return dateToStr(date) + " - " + dateToStr(endDate);
	}},
    // Day 스케일에 투사 모드를 적용
	{unit: "day", step: 1, format: "%d", projection: {source: "fixedHours"}} /*!*/
];
세 가지 투사 모드가 있습니다:
- 기본 모드(default mode)
투사가 설정되지 않은 경우 기본 모드에서는 위치 지정을 위해 절대 시간(00:00-24:00)을 사용합니다.
- 고정 시간 모드(fixed hours mode)
이 모드에서는 스케일의 모든 작업에 대해 고정 근무 시간이 적용됩니다. 기본적으로 시간은 전역 근무 일정에서 가져옵니다.
gantt.config.scales = [
	{
    	unit: "day",
        step: 1,
        format: "%d",
        projection: {source: "fixedHours"} /*!*/
    }
];
투사 시간을 명시적으로 설정할 수 있습니다:
gantt.config.scales = [
	{
    	unit: "day",
        step: 1,
        format: "%d",
    	projection: {source: "fixedHours", hours: ["09:00-18:00"] } /*!*/
    }
];
- 작업 캘린더 모드(task calendar mode)
이 모드는 각 셀의 근무 시간을 계산하기 위해 작업 캘린더를 사용한다고 가정합니다. 셀에 근무 시간이 없으면 해당 셀은 절대 위치로 배치됩니다.
gantt.config.scales = [
	{
    	unit: "day",
        step: 1,
        format: "%d",
    	projection: {source: "taskCalendar" } /*!*/
    }
];
세부 정보
투사 모드는 Day 및 Week 스케일에 대해 설계되었음을 주의하십시오. 다른 단위는 투사를 무시하고 절대 위치를 사용합니다.
드래그 앤 드롭은 투사를 따르지만 자동 스케줄링이 적용되면 작업의 스케줄링 로직은 correct_work_time 및 작업에 적용된 작업 시간 캘린더 등의 설정에 여전히 의존합니다.