设置时间刻度
通过 scales 属性来指定刻度的配置。你可以在 scales 配置的数组中设置任意数量的刻度对象:
// 单日刻度
gantt.config.scales = [
	{ unit: "day", step: 1, format: "%j, %D" }
];

// 同时设置若干刻度
gantt.config.scales = [
	{ unit: "month", step: 1, format: "%F, %Y" },
	{ unit: "week", step: 1, format: weekScaleTemplate },
	{ unit: "day", step: 1, format: "%D", css: daysStyle }
];
可以配置时间刻度(X 轴)的以下方面:
你也可以添加一个 custom scale。
Time units

要设置刻度的单位,请在相应的刻度对象中使用 unit 属性:
可选值为: "minute"、"hour"、默认值为 "day"、"week"、"quarter"、"month"、"year"。
gantt.config.scales = [
	{ unit: "month", step: 1, format: "%F, %Y" },
	{ unit: "day", step: 1, format: "%j, %D" }
];

gantt.init("gantt_here");
Range
默认范围设置
如果你未显式指定日期范围,Gantt 将使用已加载任务的日期,并在刻度中在第一个任务之前和最后一个任务之后添加偏移。偏移量由时间刻��度的设置决定。 根据 scale_offset_minimal 的值,它将是通过 scales 选项中的 unit 属性定义的时间单位,或者按时间刻度单位中最小的单位来确定。
你可以通过 getState 方法以编程方式获取显示的日期范围。
const state = gantt.getState();

console.log(state.min_date);
// -> Mon Jan 01 2025 00:00:00

console.log(state.max_date);
// -> Tue Jan 01 2026 00:00:00
时间刻度的范围在 gantt 渲染 时重新计算。若用户将任务移动到显示时间范围之外,任务行将显示,但条形元素在完全重绘完成前不会可见。
若要自动调整刻度,请使用 fit_tasks 配置。
gantt.config.fit_tasks = true;
gantt.init("gantt_here");
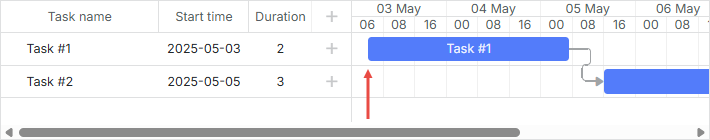
显式设置日期范围
或者,你可以通过 start_date 和 end_date 配置项显式设置日期范围:
gantt.config.start_date = new Date(2025, 02, 31);
gantt.config.end_date = new Date(2025, 03, 09);

gantt.init("gantt_here");
也可以在 gantt 初始化 调用中指定:
gantt.init("gantt_here", new Date(2025, 02, 31), new Date(2025, 03, 09));
不在指定区间的任务将不会在甘特图中显示,除非它们被 标记为未计划。
注意
如果同时指定了 start_date 和 end_date,并且你创建了一个在该范围之外的任务,该任务将从图表中消失。 在图表中显示该任务,请在图表中使用 show_tasks_outside_timescale 配置。
gantt.config.start_date = new Date(2025, 02, 31);
gantt.config.end_date = new Date(2025, 03, 09);
gantt.config.show_tasks_outside_timescale = true;

gantt.init("gantt_here");
如果不使用此配置,可以通过以下逻辑扩展范围:
gantt.attachEvent("onLightboxSave", (id, task, is_new) => {
	const { start_date: taskStart, end_date: taskEnd } = task;
	const { start_date: scaleStart, end_date: scaleEnd } = gantt.config;

	// 如果任务超出当前时间刻度范围
	if (scaleStart > taskEnd || scaleEnd < taskStart) {
		// 更新时间刻度范围
		gantt.config.end_date = new Date(
			Math.max(taskEnd.valueOf(), scaleEnd.valueOf())
		);

		gantt.config.start_date = new Date(
			Math.min(taskStart.valueOf(), scaleStart.valueOf())
		);

		gantt.render();
	}

	return true;
});
或者为 lightbox 控件添加校验:
gantt.attachEvent("onLightboxSave", (id, task, is_new) => {
	const { start_date: taskStart, end_date: taskEnd } = task;
	const { start_date: scaleStart, end_date: scaleEnd } = gantt.config;

	// 检查任务是否超出范围
	if (scaleStart > taskEnd || scaleEnd < taskStart) {
		gantt.message({
			type: "warning",
			text: "Warning! The task is outside the date range!",
			expire: 5000
		});

		return false;
	}

	return true;
});
动态改变显示范围
有多种方式可以在运行时动态改变显示的范围:
- 你可以通过 start_date / end_date 配置来控制时间范围,但要动态地将它们调整为显示已加载的任务。
你可以通过 recalculating the scale range 的方式,在每次重新绘制 gantt 时更新 start_date / end_date:
gantt.attachEvent("onBeforeGanttRender", () => {
	const range = gantt.getSubtaskDates();
	const scaleUnit = gantt.getState().scale_unit;

	if (range.start_date && range.end_date) {
		gantt.config.start_date = gantt.calculateEndDate(
			range.start_date, -4, scaleUnit
		);

		gantt.config.end_date = gantt.calculateEndDate(
			range.end_date, 5, scaleUnit
		);
	}
});

gantt.init("gantt_here");
- 要在每次任务不再现有刻度区间内时“强制”重新渲染刻度,请将 fit_tasks 属性设置为 true:
gantt.config.fit_tasks = true;
gantt.init("gantt_here");
如果同时指定了 start_date 和 end_date 选项,则需要使用上述任一选项,以便让 [fit_tasks] 属性正确工作。
- 也可以在拖动任务时自动更改刻度,只需在 onTaskDrag 事件的处理程序中实现所需逻辑:
gantt.attachEvent("onTaskDrag", (id, mode, task, original) => {
	const state = gantt.getState();
	const minDate = state.min_date;
	const maxDate = state.max_date;

	const scaleStep = gantt.date.add(
		new Date(), state.scale_step, state.scale_unit
	) - new Date();

	let showDate;
	let repaint = false;

	if (mode == "resize" || mode == "move") {
		if (Math.abs(task.start_date - minDate) < scaleStep) {
			showDate = task.start_date;
			repaint = true;
		} else if (Math.abs(task.end_date - maxDate) < scaleStep) {
			showDate = task.end_date;
			repaint = true;
		}

		if (repaint) {
			gantt.render();
			gantt.showDate(showDate);
		}
	}
});
相关示例 [Re-rendering Scale during Task Dragging]
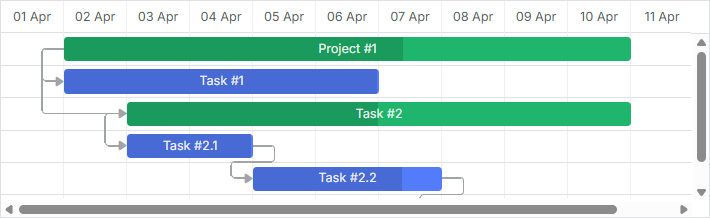
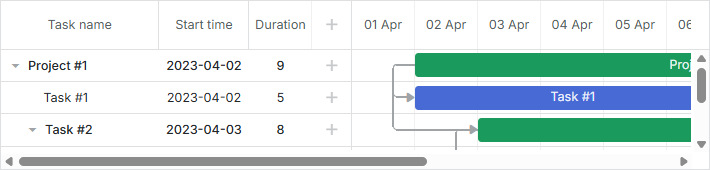
显示在显式日期范围之外的任务
可以在甘特图中显示不符合 显式日期范围 的任务。
要做到这一点,需要将 show_tasks_outside_timescale 配置参数设置为 true:
const data = {
	tasks: [
		{ id: 1, text: "Project #1", start_date: "01-09-2024", end_date: "02-09-2024" },
		{ id: 2, text: "Project #2", start_date: "01-09-2026", end_date: "02-09-2026" },
		{ id: 3, text: "Task #1", start_date: "03-02-2025", end_date: "05-02-2025" }
	],
	links: []
};

gantt.config.show_tasks_outside_timescale = true;

gantt.init("gantt_here", new Date(2025, 1, 1), new Date(2025, 1, 7));
因此,在时间线区域将显示 id 为 "1" 和 "2" 的任务为空行,同时在网格中显示它们的名称与开始日期。
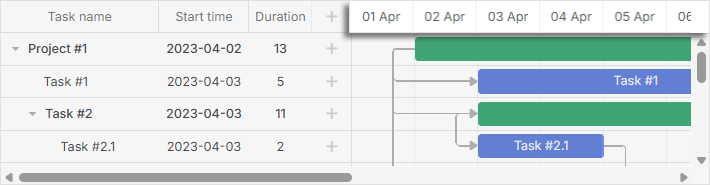
Time step
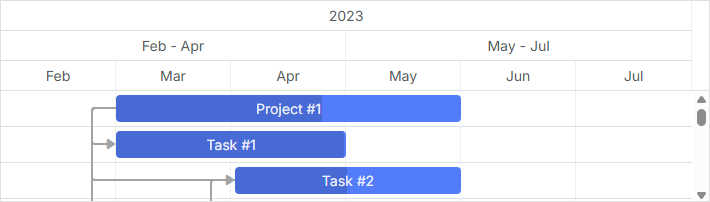
要设置时间刻度的步长,请在相应刻度对象中使用 step 属性:
const monthScaleTemplate = (date) => {
	const dateToStr = gantt.date.date_to_str("%M");
	const endDate = gantt.date.add(date, 2, "month");

	return `${dateToStr(date)} - ${dateToStr(endDate)}`;
};

gantt.config.scales = [
	{ unit: "year", step: 1, format: "%Y" },
	{ unit: "month", step: 3, format: monthScaleTemplate },
	{ unit: "month", step: 1, format: "%M" }
];

gantt.init("gantt_here");
Height
要设置刻度的高度,请使用 scale_height 属性:
gantt.config.scale_height = 54; /*!*/
gantt.init("gantt_here");
如果你有多个刻度,它们将平均分摊指定的高度。例如,如果 scale_height 为 60 像素且你有 3 个刻度,则每个刻度的高度将为 60 / 3 = 20 像素。
Date format
请参阅 [Date Format Specification] 文章,了解可用的格式字符
要设置刻度的日期格式,请在相应刻度对象中使用 format 属性。日期格式可以设置为字符串:
gantt.config.scales = [
	{ unit: "month", step: 1, format: "%F, %Y" },
	{ unit: "week", step: 1, format: weekScaleTemplate },
	{ unit: "day", step: 1, format: "%D", css: daysStyle }
];

gantt.init("gantt_here");
或者使用一个接收 Date 对象作为参数的函数:
gantt.config.scales = [
	{ unit: "day", step: 1, format: (date) => {
		return `<strong>Day ${dayNumber(date)}</strong><br/>${dateFormat(date)}`;
	}}
];
Styling
要对时间刻度的单元格进行样式设置,请在相应刻度对象中使用 css 属性。
function getWeekOfMonthNumber(date) {
	let adjustedDate = date.getDate() + date.getDay();
	let prefixes = ['0', '1', '2', '3', '4', '5'];
	return (parseInt(prefixes[0 | adjustedDate / 7]) + 1);
}

gantt.config.scales = [
	{ unit: "month", step: 1, format: "%F, %Y" },
	{ unit: "week", step: 1, format: (date) => {
		return "Week #" + getWeekOfMonthNumber(date);
	}},
	{ unit: "day", step: 1, format: "%j %D", css: (date) => {
		if (!gantt.isWorkTime(date)) {
			return "week-end";
		}
	}}
];
相关示例 Styling of cells of the time scale
如果没有在 scales 的配置中指定 css 属性,你可以定义 scale_cell_class 模板,为 scales 配置数组中的第一个时间刻度应用 CSS 类。
gantt.config.scales = [
	{ unit: "day", step: 1, format: "%d" },
	{ unit: "day", step: 1, format: "%D" },
	{ unit: "hour", step: 1, format: "%H" }
];

gantt.templates.scale_cell_class = date => gantt.isWorkTime(date) ? "" : "week_end";
相关示例 Styling of the first time scale
要将 scale_cell_class 模板应用到时间刻度的所有刻度,请将 inherit_scale_class 属性设置为 true。
gantt.config.inherit_scale_class = true; /*!*/
在使用 工作时间计算 时,请注意你可以使用 isWorkTime 来替代硬编码的值:
gantt.config.work_time = true;
gantt.templates.scale_cell_class = date => gantt.isWorkTime(date) ? "" : "week_end";
更多关于在时间轴区域应用自定义样式,请参阅 [Highlighting Time Slots] 文章。
Custom time units
dhtmlxGantt 允许你定义自定义时间单位,并在刻度配置中为标签设定模板。
要定义自定义单位,需要在 Date 对象 中定义 2 个函数:
Date gantt.date.<unit>_start(Date date);
Date gantt.date.add_<unit>(Date date, Integer increment);
- 第一个函数应返回给定日期的起始时间单位(例如对 14 Feb 返回 1st Feb 的 month_start)。
- 第二个函数按给定的持续单位数增加日期(例如“日期减去 2 天”)
通常,增量值为正,因为刻度单元格是从左向右创建的。但首个单元格的创建是从右向左实现的,因此 Gantt 使用增量的负值。
示例 1
让我们创建一个 "fiscal_year" 单位,假设一个财年在 1 月 31 日结束。以下方式可以定义新单位:
const firstMonth = 1;
const firstDay = 1;

gantt.date.fiscal_year_start = date => {
	let next = new Date(date);

	if (next.getMonth() < firstMonth ||
		(next.getMonth() === firstMonth && next.getDate() < firstDay)) {
		next = gantt.date.add(next, -1, "year");
	}

	next = gantt.date.year_start(next);
	next.setMonth(firstMonth);
	next.setDate(firstDay);

	return next;
};

gantt.date.add_fiscal_year = (date, inc) => gantt.date.add(date, inc, "year");
然后在代码中使用它,如下:
const dateToStr = gantt.date.date_to_str("%Y");

const fiscalYearLabel = date => dateToStr(gantt.date.fiscal_year_start(date));

gantt.config.scales = [
    { unit: "year", step: 1, format: "Calendar year %Y" },
    { unit: "fiscal_year", step: 1, format: fiscalYearLabel },
    { unit: "month", step: 1, format: "%M %Y" },
    { unit: "day", step: 1, format: "%d %M" }
];
示例 2
你可以将每个 "day" 单元格分成三个 "hour" 单元,并标注 00、08、16。逻辑如下所示:
gantt.date.hour_custom_start = date => date;

gantt.date.add_hour_custom = (date, inc) => { // inc 取决于 "step"
    const nextDate = new Date(date);

    if (nextDate.getHours() % 8 !== 0) { // 小时值不是 0、8、16 之一 /*!*/
        const diff = Math.abs(8 - nextDate.getHours()); /*!*/
        return gantt.date.add(nextDate, diff * inc, "hour"); /*!*/
    } /*!*/

    return gantt.date.add(date, 8 * inc, "hour"); /*!*/
};

gantt.config.scales = [
    { unit: "day", step: 1, date: "%d %F" },
    { unit: "hour_custom", step: 1, date: "%H" }
];

gantt.config.date_grid = "%Y-%m-%d %H:%i";
让我们��来看看 Gantt 如何创建第一个 "hour" 单元格。如上例所示,最早的任务在 07:00 开始。但 7 不是 8 的倍数,因此 Gantt 遵循以下规则:
if (nextDate.getHours() % 8 != 0) {
	const diff = Math.abs(8 - nextDate.getHours());  // 8 - 7 = 1
	return gantt.date.add(nextDate, diff * inc, "hour"); // 7 - 1 = 6
}
- Gantt 计算 8:00 与 7:00 之间的时间间隔:
diff = 08:00 - 07:00 = 1 小时
- 然后,Gantt 计算时间间隔与增量的乘积:
diff * inc = 1 小时 * (-1) = -1 小时
作为参数 inc 的值,Gantt 使用时间步长的负值(-1)。
- 最后,Gantt 将得到的数值加到最早任务的时间上:
07:00 + (- 1 小时) = 06:00
第一个单元格的值为 06。
要创建第二个 "hour" 单元格,Gantt 遵循相同的逻辑,但使用正增量
-
diff = 08:00 - 06:00 = 2 小时
-
diff * inc = 2 小时 * 1 = 2 小时
-
06:00 + 2 小时 = 08:00
第二个单元格的值为 08
此时可见 8 是 8 的倍数,因此下一个单元格的值将计算为 08:00 + 8 小时 = 16:00,依此类推。
此逻辑之所以成立,是因为我们没有显式指定 date range。
欲获得更多示例,请查阅 How to add a custom scale 文章。
Custom time spans
在这一部分你将看到如何自定义并配置时间刻度,使其显示或隐藏非工作时间段。此外,你还会看到在跳过非工作时间模式(skip_off_time)开启的情况下,如何从刻度起始处隐藏非工作时间单元格的示例。
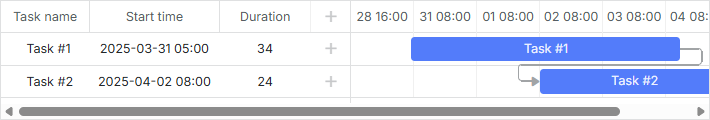
下面给出一个常见场景的自定义刻度示例:工作时间为 08:00-12:00 与 13:00-17:00。
gantt.plugins({
	auto_scheduling: true,
});

gantt.config.work_time = true;
gantt.config.correct_work_time = true;
gantt.config.duration_unit = "minute";
gantt.config.duration_step = 1;
gantt.config.time_step = 1;
gantt.config.round_dnd_dates = false;

gantt.setWorkTime({ hours: ["8:00-12:00", "13:00-17:00"] }); /*!*/

gantt.date.day_custom_start = date => date; /*!*/

gantt.date.add_day_custom = (date, inc) => { /*!*/
	const nextDate = new Date(date); /*!*/

	if (nextDate.getHours() < 8) { /*!*/ // 语句 1
		const diff = 8 - nextDate.getHours(); /*!*/
		return gantt.date.add(nextDate, diff * inc, "hour"); /*!*/
	} /*!*/

	if (nextDate.getHours() === 8) { /*!*/ // 语句 2
		return gantt.date.add(nextDate, 9 * inc, "hour"); /*!*/
	} /*!*/

	if (nextDate.getHours() === 17) { /*!*/ // 语句 3
		return gantt.date.add(nextDate, 15 * inc, "hour"); /*!*/
	} /*!*/

	return gantt.date.add(date, 8 * inc, "hour"); /*!*/
}; /*!*/

gantt.config.scales = [
	{ unit: "day_custom", step: 1, date: "%d %H:00" },
];

gantt.config.work_time = true;
gantt.config.skip_off_time = false; /*!*/
相关示例 Equal offset for custom scales
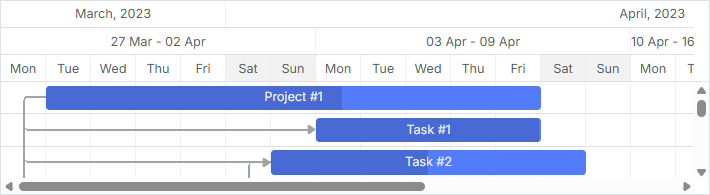
这是在隐藏非工作时间时刻度的显示方式:
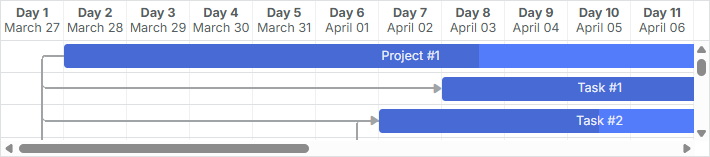
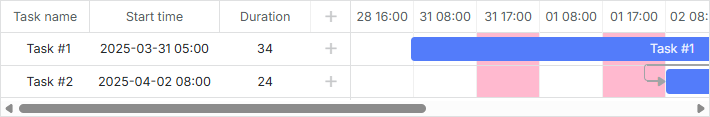
而当它们显示时的样子(禁用 gantt.config.skip_off_time)则为:
无限滚动
你可以在相关 how-to 有关无限滚动的文章 中找到实现时间轴无限滚动的详细示例。
粘性标签
自 v9.0 起,时间刻度标签默认是粘性的。这意味着当单元格宽度远大于标签宽度时,标签在滚动时间轴时将保持可见,直至滚动出视口才会消失。这提升了在放大或缩小时刻度标签的可见性。
若想回到旧行为,即标签在单元格内居中且滚动时不始终可见,可以将刻度对象的 sticky 属性设为 false:
gantt.config.scales = [
	{ unit: "year", step: 1, format: "%Y", sticky: false },
	{ unit: "month", step: 1, format: "%F", sticky: false },
	{ unit: "day", step: 1, format: "%j", sticky: false }
];

gantt.init("gantt_here");
你也可以为某个特定刻度强制开启粘性标签,即使标签宽度小于单元格宽度:
gantt.config.scales = [
	{ unit: "year", step: 1, format: "%Y", sticky: true },
	{ unit: "month", step: 1, format: "%F", sticky: true },
	{ unit: "day", step: 1, format: "%j", sticky: true }
];

gantt.init("gantt_here");
固定列宽
默认情况下,时间线列具有自适应宽度。它们要么扩展以填满容器的宽度,要么收缩到在出现水平滚动条前的最小列宽 min_column_width 。
你可以通过在刻度对象中设置 column_width 属性,将底部刻度的宽度锁定为固定值:
gantt.config.scales = [
	{ unit: "year", step: 1, format: "%Y" },
	{ unit: "month", step: 1, format: "%F" },
	{ unit: "day", step: 1, format: "%j", column_width: 60 } /*!*/
];

gantt.init("gantt_here");
设置后,底部刻度中的每个单元格(上例中的 "day")将恰好为 60 像素宽,无论渲染了多少列:
- 如果列数太少,容器右边将留空未用。
- 如果列数过多,将出现水平滚动条。
请注意,column_width 仅应用于 gantt.config.scales 中底部的刻度项;在更高层级设置将不起作用。
另请注意,在设置了 column_width 时,底部刻度不会应用 gantt.config.min_column_width。
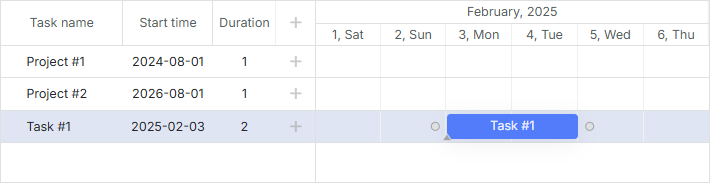
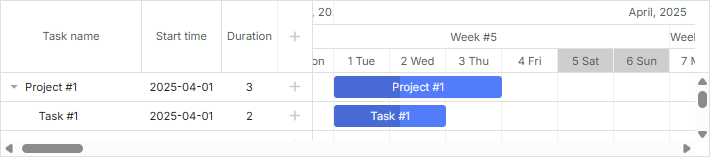
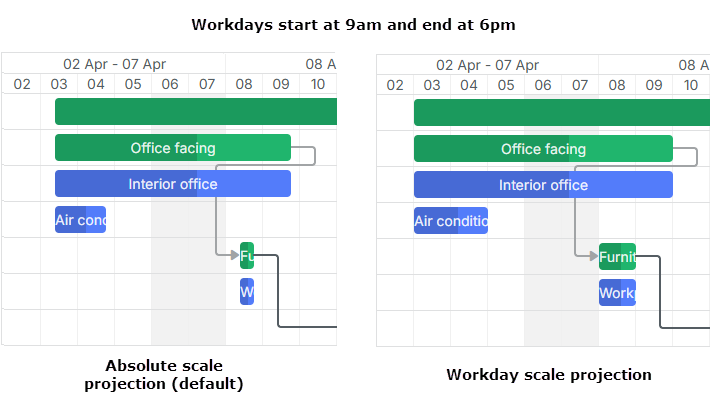
Day/Week 刻度的工作时间感知任务条的渲染
你可以按照刻度单元格边缘的“工作时间”来定位和调整任务条的大小,而不是简单使用原始的 00:00-24:00 区间,使用所谓的 scale projection。 这样一个跨越整整一个工作日(如 09:00-17:00)的任务就会占满整天的单元格,提升密集时间线的可读性。
要设置投影模式,请在底部刻度对象中使用 projection 属性:
gantt.config.scales = [
	{unit: "month", step: 1, format:"%M %Y"},
	{unit: "week", step: 1, format: function (date) {
		const dateToStr = gantt.date.date_to_str("%d %M");
		const endDate = gantt.date.add(date, 7 - date.getDay(), "day");
		return dateToStr(date) + " - " + dateToStr(endDate);
	}},
    // 将投影模式应用到 Day 刻度
	{unit: "day", step: 1, format: "%d", projection: {source: "fixedHours"}} /*!*/
];
共有三种投影模式可用:
- 默认模式(default mode)
在默认模式下,如果未设置投影,刻度使用绝对时间(00:00-24:00)来定位。
- 固定小时模式(fixed hours mode)
在此模式下,所有任务在时间刻度上都应用固定的工作时间。默认情况下,小时从全局工作日历中取得。
gantt.config.scales = [
	{
    	unit: "day",
        step: 1,
        format: "%d",
        projection: {source: "fixedHours"} /*!*/
    }
];
投影小时可以显式设置:
gantt.config.scales = [
	{
    	unit: "day",
        step: 1,
        format: "%d",
    	projection: {source: "fixedHours", hours: ["09:00-18:00"] } /*!*/
    }
];
- 任务日历模式(task calendar mode)
该模式假设使用任务日历来计算每个单元格的工作时间。 如果某个单元格没有工作时间,刻度将回退到该单元格的绝对定位。
gantt.config.scales = [
	{
    	unit: "day",
        step: 1,
        format: "%d",
    	projection: {source: "taskCalendar" } /*!*/
    }
];
细节
请注意,投影模式主要为 Day 与 Week 刻度设计。其他单位将忽略投影,使用绝对定位。
拖放操作遵循投影,但在应用了自动排程(autoscheduling)时,任务的排程逻辑仍然取决于诸如 correct_work_time 以及应用于任务的工作日历等设置。