设置时间刻度
你可以通过 scales 属性来配置时间刻度。通过在配置项中的 scales 数组添加刻度对象,可以定义多个时间刻度:
// 单一日刻度
gantt.config.scales = [
    {unit: "day", step: 1, format: "%j, %D"}
];

// 同时设置多个刻度
gantt.config.scales = [
    {unit: "month", step: 1, format: "%F, %Y"},
    {unit: "week", step: 1, format: weekScaleTemplate},
    {unit: "day", step:1, format: "%D", css:daysStyle }
];
你可以调整时间刻度(X轴)的以下方面:
你也可以选择添加自定义刻度。
时间单位

要为刻度定义单位,请在刻度对象中使用 unit 属性:
可选值包括:"minute"、"hour"、"day"(默认)、"week"、"quarter"、"month" 和 "year"。
gantt.config.scales = [
    {unit: "month", step: 1, format: "%F, %Y"},
    {unit: "day", step: 1, format: "%j, %D"}
];

gantt.init("gantt_here");
范围
默认时间范围设置
当未明确指定日期范围时,Gantt 会从已加载的任务中获取日期,并在时间轴上第一个任务之前和最后一个任务之后添加一定的偏移量。偏移量的大小取决于时间轴的设置。 根据 scale_offset_minimal 的值,偏移量将会是 scales 选项中 unit 属性定义的时间单位,或者是时间轴的最小单位。
你可以通过 getState 方法以编程方式获取当前显示的日期范围。
var state = gantt.getState();

console.log(state.min_date);
// -> Mon Jan 01 2018 00:00:00

console.log(state.max_date);
// -> Tue Jan 01 2019 00:00:00
时间轴范围会在 gantt 渲染 期间重新计算。如果用户将任务移动到可见时间范围之外,任务行仍然可见,但条形元素不会显示,直到整个图表被重绘。
要让时间轴自动调整,请启用 fit_tasks 选项。
gantt.config.fit_tasks = true;
gantt.init("gantt_here");
显式设置日期范围
你也可以通过 start_date 和 end_date 选项显式定义日期范围:
gantt.config.start_date = new Date(2018, 02, 31);
gantt.config.end_date = new Date(2018, 03, 09);

gantt.init("gantt_here");
这些日期也可以在 gantt 初始化 时直接设置:
gantt.init("gantt_here", new Date(2018, 02, 31), new Date(2018, 03, 09));
超出定义区间的任务不会在 Gantt 图中显示,除非它们被标记为未排期。
注意
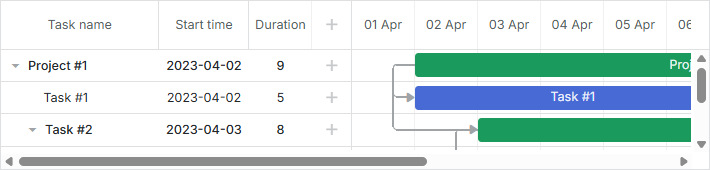
如果同时设置了 start_date 和 end_date,并且你添加了一个超出此范围的任务,该任务不会在图表上显示。 要显示这些任务,请启用 show_tasks_outside_timescale 选项。
gantt.config.start_date = new Date(2019, 02, 31);
gantt.config.end_date = new Date(2019, 03, 09);
gantt.config.show_tasks_outside_timescale = true;

gantt.init("gantt_here");
如果你不使用此选项,也可以动态扩展日期范围:
gantt.attachEvent("onLightboxSave", function(id, task, is_new){
 var taskStart = task.start_date;
 var taskEnd = task.end_date;
 var scaleStart = gantt.config.start_date;
 var scaleEnd = gantt.config.end_date;

 // 如果任务超出范围
 if(scaleStart > taskEnd || scaleEnd < taskStart ){
  // 更新时间轴范围
  gantt.config.end_date = new Date(Math.max(taskEnd.valueOf(), scaleEnd.valueOf()));
  gantt.config.start_date = new Date(Math.min(taskStart.valueOf(), scaleStart.valueOf()));
  gantt.render();
 }
 return true;
});
或者,你可以在弹窗中添加校验,阻止保存超出范围的任务:
gantt.attachEvent("onLightboxSave", function(id, task, is_new){
     var taskStart = task.start_date;
     var taskEnd = task.end_date;
     var scaleStart = gantt.config.start_date;
     var scaleEnd = gantt.config.end_date;

    // 检查任务是否超出范围
    if(scaleStart > taskEnd || scaleEnd < taskStart ){
        gantt.message({
            type: "warning",
            text: "Warning! The task is outside the date range!",
            expire: 5000
        });
        return false;
    }
    return true;
});
动态更改显示范围
有几种方法可以动态更新显示的日期范围:
- 通过 start_date 和 end_date 配置项控制时间范围,并根据已加载的任务动态更新。 可以通过重新计算时间轴范围并在 gantt 即将渲染时更新 start_date 和 end_date 实现:
gantt.attachEvent("onBeforeGanttRender", function(){
   var range = gantt.getSubtaskDates();
   var scaleUnit = gantt.getState().scale_unit;
   if(range.start_date && range.end_date){
     gantt.config.start_date = gantt.calculateEndDate(range.start_date, -4, scaleUnit);
     gantt.config.end_date = gantt.calculateEndDate(range.end_date, 5, scaleUnit);
   }
});

gantt.init("gantt_here");
- 如果希望每当有任务超出当前时间轴区间时强制重绘时间轴,请将 fit_tasks 属性设置为 true:
gantt.config.fit_tasks = true;
gantt.init("gantt_here");
如果同时设置了 start_date 和 end_date,请记得结合上述方法使用 fit_tasks 选项以确保其正常工作。
- 你还可以在拖动任务时,通过在 onTaskDrag 事件处理器中添加逻辑,实现动态更新时间轴:
gantt.attachEvent("onTaskDrag", function(id, mode, task, original){
 var state = gantt.getState();
 var minDate = state.min_date,
       maxDate = state.max_date;

 var scaleStep = gantt.date.add(new Date(), state.scale_step, state.scale_unit) - new Date();

 var showDate,
  repaint = false;
  if(mode == "resize" || mode == "move"){
    if(Math.abs(task.start_date - minDate) < scaleStep){
      showDate = task.start_date;
      repaint = true;

    } else if(Math.abs(task.end_date - maxDate) < scaleStep){
      showDate = task.end_date;
      repaint = true;
    }

    if(repaint){
      gantt.render();
      gantt.showDate(showDate);
    }
  }
});
Related example: Re-rendering Scale during Task Dragging
显示超出显式日期范围的任务
你可以在 Gantt 图中显示超出指定日期范围的任务。
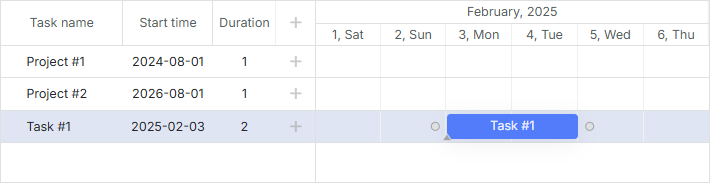
为此,请将 show_tasks_outside_timescale 选项设置为 true:
var data = {
  "tasks": [
    {"id":1, "text":"Project #1", "start_date": "01-09-2018", "end_date": "02-09-2018"},
    {"id":2, "text":"Project #2", "start_date": "01-09-2021", "end_date": "02-09-2021"},
    {"id":3, "text":"Task #1", "start_date": "03-02-2020", "end_date": "05-02-2020"},
    ],
    "links":[]
};

gantt.config.show_tasks_outside_timescale = true;

gantt.init("gantt_here", new Date(2020, 1, 1), new Date(2020, 2, 1));
这样,ID 为 "1" 和 "2" 的任务会作为空行显示在时间线区域,在表格中显示它们的名称和开始日期。
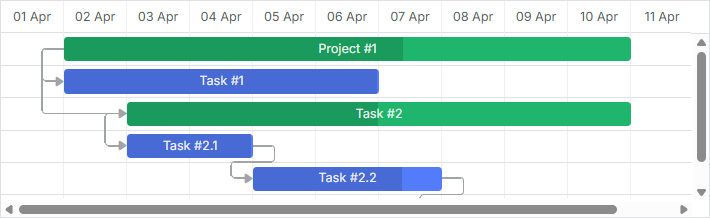
时间步长
要定义时间轴的步长,请在时间轴配置对象中使用 step 属性:
var monthScaleTemplate = function (date) {
    var dateToStr = gantt.date.date_to_str("%M");
    var endDate = gantt.date.add(date, 2, "month");
    return dateToStr(date) + " - " + dateToStr(endDate);
};

gantt.config.scales = [
    {unit: "year", step: 1, format: "%Y"},
    {unit: "month", step: 3, format: monthScaleTemplate},
    {unit: "month", step: 1, format: "%M"}
];

gantt.init("gantt_here");
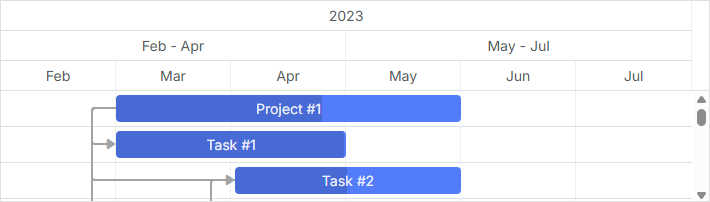
Step config for the Quarter scale
高度
要调整时间轴的高度,请使用 scale_height 属性:
gantt.config.scale_height = 54; /*!*/

gantt.init("gantt_here");
如果使用了多个时间轴,指定的高度会被平均分配。例如,scale_height 为 60 像素且有 3 个时间轴时,每个时间轴高度为 20 像素。
日期格式
请参阅 날짜 형식 지정 文章,了解可用的格式字符
你可以在每个时间轴对象的 format 属性中设置日期格式。它可以是字符串:
gantt.config.scales = [
    {unit: "month", step: 1, format: "%F, %Y"},
    {unit: "week", step: 1, format: weekScaleTemplate},
    {unit: "day", step: 1, format: "%D", css: daysStyle }
];

gantt.init("gantt_here");
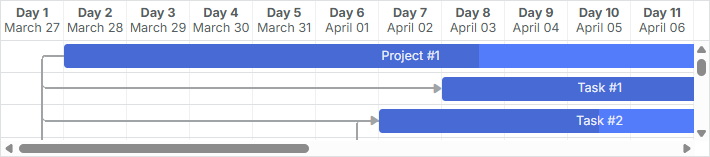
也可以是接收日期对象并返回格式化字符串的函数:
gantt.config.scales = [
  { unit: "day", step: 1, format: function(date){
    return "<strong>Day " + dayNumber(date) + "</strong>

" + dateFormat(date);
  }}
]
样式
要为时间轴单元格设置样式,请在时间轴对象中使用 css 属性。
function getWeekOfMonthNumber(date){
let adjustedDate = date.getDate() + date.getDay();
let prefixes = ['0', '1', '2', '3', '4', '5'];
return (parseInt(prefixes[0 | adjustedDate / 7]) + 1);
}
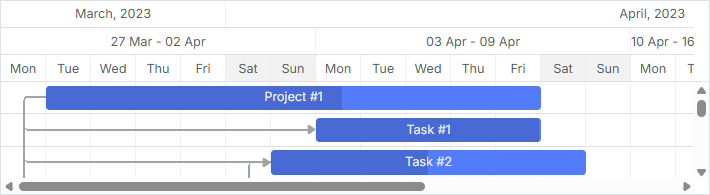
gantt.config.scales = [
{unit: "month", step: 1, format: "%F, %Y"},
{unit: "week", step: 1, format: function(date){
return "Week #" + getWeekOfMonthNumber(date);
}},
{unit: "day", step: 1, format: "%j %D", css: function(date) { /*!*/
if(!gantt.isWorkTime(date)){
return "week-end";
}
}}
];
Related example: Styling of cells of the time scale
如果未在时间轴配置中设置 css 属性,可以使用 scale_cell_class 模板为 scales 数组中的第一个时间轴应用 CSS 类。
function getWeekOfMonthNumber(date){
    let adjustedDate = date.getDate() + date.getDay();
    let prefixes = ['0', '1', '2', '3', '4', '5'];
    return (parseInt(prefixes[0 | adjustedDate / 7]) + 1);
}

gantt.config.scales = [
    {unit: "month", step: 1, format: "%F, %Y"},
    {unit: "week", step: 1, format: function(date){
       return "Week #" + getWeekOfMonthNumber(date);
    }},
    {unit: "day", step: 1, format: "%j %D"}
];

gantt.templates.scale_cell_class = function(date) {
         if(!gantt.isWorkTime(date)){
             return "week-end";
         }
};
Related example: Styling of the first time scale
要将 scale_cell_class 模板应用于所有时间轴,请设置 inherit_scale_class 选项为 true。
gantt.config.scales = [
    {unit: "month", step: 1, format: "%F, %Y"},
    {unit: "week", step: 1, format: function(date){
       return "Week #" + getWeekOfMonthNumber(date);
    }},
    {unit: "day", step: 1, format: "%j %D"}
];

gantt.templates.scale_cell_class = function(date) {
         if(!gantt.isWorkTime(date)){
             return "week-end";
         }
};
gantt.config.inherit_scale_class = true; /*!*/
Related example: Styling of all scales
在进行工作时间计算时,建议使用 isWorkTime,而不是硬编码的值:
gantt.config.work_time = true;

gantt.templates.scale_cell_class = function(date){
   if(!gantt.isWorkTime(date)){
      return "weekend";
   }
};
关于自定义时间线区域样式的更多内容,请参见 타임 슬롯 하이라이트하기 文章。
自定义时间单位
dhtmlxGantt 允许你创建自定义时间单位,并在时间轴配置中设置标签模板。
要定义自定义单位,需要在 Date 对象上实现两个函数:
Date gantt.date.<unit>_start(Date date);
Date gantt.date.add_<unit>(Date date, Integer increment);
- 第一个函数返回给定日期的时间单位起始(例如,month_start,2月14日返回2月1日)。
- 第二个函数为日期添加指定数量的单位(例如,减去2天)。
通常,步长为正值,因为时间轴单元格是从左到右创建的。但第一个单元格是从右到左创建的,所以 Gantt 在这种情况下会使用负增量。
示例 1
下面介绍如何定义一个"fiscal_year"(财年)单位,假设财年在1月31日结束。可以通过以下方式指定新的单位:
var firstMonth = 1,
    firstDay = 1;

gantt.date.fiscal_year_start = function(date){       /*!*/
   var next = new Date(date);
   if(next.getMonth() < firstMonth ||
      (next.getMonth() === firstMonth && next.getDate() < firstDay)){
      next = gantt.date.add(next, -1, "year");
   }

  next = gantt.date.year_start(next);
  next.setMonth(firstMonth);
  next.setDate(firstDay);

  return next;
};

gantt.date.add_fiscal_year = function(date, inc){    /*!*/
   return gantt.date.add(date, inc, "year");
};
然后,可以像下面这样在代码中使用:
var dateToStr = gantt.date.date_to_str("%Y");
function fiscalYearLabel(date){
    return dateToStr(gantt.date.fiscal_year_start(date));
};

gantt.config.scales = [
  {unit:"year", step:1, format:"Calendar year %Y"},
  {unit:"fiscal_year", step:1, format:fiscalYearLabel},
  {unit:"month", step: 1, format: "%M %Y"},
  {unit:"day", step: 1, format:"%d %M"}
];
示例 2
可以将每个"day"单元格分为三个"hour"单元格,分别标记为00、08和16。实现逻辑如下:
gantt.date.hour_custom_start = function (date) {
    return date;
};

gantt.date.add_hour_custom = function (date, inc) { // inc 取决于 "step"
    const nextDate = new Date(date);
    if (nextDate.getHours() % 8 != 0) { // 小时值不是0、8或16 /*!*/
        const diff = Math.abs(8 - nextDate.getHours()); /*!*/
        return gantt.date.add(nextDate, diff * inc, "hour"); /*!*/
    } /*!*/
    return gantt.date.add(date, 8 * inc, "hour"); /*!*/
};

gantt.config.scales = [
    { unit: "day", step: 1, date: "%d %F" },
    { unit: "hour_custom", step: 1, date: "%H" },
];

gantt.config.date_grid = "%Y-%m-%d %H:%i"
Related example: Custom hours on the scale
为了理解 Gantt 如何确定第一个"hour"单元格,可以考虑最早的任务在07:00开始。由于7不是8的倍数,Gantt 会应用如下规则:
if (nextDate.getHours() % 8 != 0) {
    const diff = Math.abs(8 - nextDate.getHours());  // 8 - 7 = 1
    return gantt.date.add(nextDate, diff * inc, "hour"); // 7 - 1 = 6
}
- Gantt 计算 8:00 和 7:00 之间的时间差:
diff = 08:00 - 07:00 = 1 小时
- 然后将该差值乘以步长:
diff * inc = 1 小时 * (-1) = -1 小时
这里,inc 是时间步长的负值(-1)。
- 最后,将该值加到最早任务的时间上:
07:00 + (-1 小时) = 06:00
第一个单元格的值为 06。
对于第二个"hour"单元格,应用相同逻辑但步长为正:
-
diff = 08:00 - 06:00 = 2 小时
-
diff * inc = 2 小时 * 1 = 2 小时
-
06:00 + 2 小时 = 08:00
第二个单元格显示为 08。
由于8是8的倍数,接下来的单元格只需简单计算:08:00 + 8 小时 = 16:00,并且后续单元格以此类推。
这种方式之所以有效,是因为未显式指定日期范围。
更多示例请参见如何添加自定义刻度一文。
自定义时间段
本节提供了自定义时间刻度以显示或隐藏非工作时间段的示例。还包括一个示例,演示即使在启用 skip_off_time 模式时,也可以隐藏刻度开始处的非工作小时单元格。
下面是一个典型工作时间为08:00-12:00和13:00-17:00的自定义刻度示例:
gantt.date.day_custom_start = function (date) {
    return date;
};

gantt.date.add_day_custom = function (date, inc) { /*!*/
    const nextDate = new Date(date); /*!*/
    if (nextDate.getHours() < 8) { /*!*/ // 语句1
        const diff = 8 - nextDate.getHours(); /*!*/
        return gantt.date.add(nextDate, diff * inc, "hour"); /*!*/
    } /*!*/
    if (nextDate.getHours() == 8) { /*!*/ // 语句2
        return gantt.date.add(nextDate, 9 * inc, "hour"); /*!*/
    } /*!*/
    if (nextDate.getHours() == 17) { /*!*/ // 语句3
        return gantt.date.add(nextDate, 15 * inc, "hour"); /*!*/
    } /*!*/

    return gantt.date.add(date, 8 * inc, "hour"); /*!*/
};

gantt.config.scales = [
    { unit: "day_custom", step: 1, date: "%d %H:00" },
];

// gantt.config.skip_off_time = true;
gantt.config.work_time = true;
gantt.config.correct_work_time = true;
gantt.plugins({
    auto_scheduling: true,
});
gantt.setWorkTime({ hours: ["8:00-12:00", "13:00-17:00"] }); /*!*/

gantt.config.duration_unit = "minute";
gantt.config.duration_step = 1;
gantt.config.time_step = 1;
gantt.config.round_dnd_dates = false;
Related example: Custom time spans
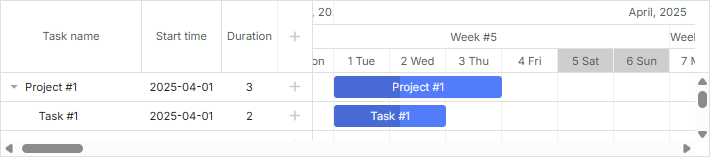
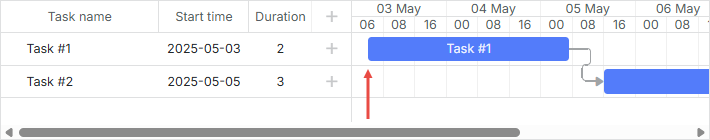
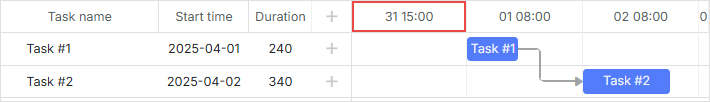
假设最早的任务在2025年4月1日08:00开始。下面展示 Gantt 如何根据 gantt.config.skip_off_time 设置,在该任务前添加偏移。
首先是隐藏非工作小时的配置:
gantt.config.skip_off_time = true;
此时,为了创建第一个"hour"单元格,Gantt 会从最早任务的时间开始,向前减去小时数,直到到达前一天的工作时间。
- 首先,从2025年4月1日08:00减去9小时(语句2):
08:00 - 9 小时 = 23:00
- 由于23:00是非工作时间且不满足任何条件,Gantt 再减去8小时:
23:00 - 8 小时 = 15:00
- 得到的时间2025年3月31日15:00处于工作时间内。
因此,第一个单元格显示为 31 15:00。
想要了解其他单元格的计算方式,可以关闭 gantt.config.skip_off_time:
gantt.config.skip_off_time = false;
如上所述,第一个单元格仍为 31 15:00,但现在在最早任务之前会显示更多空单元格,因为非工作小时也被显示出来。
这些单元格的计算逻辑如下:
- 2025年3月31日15:00为工作时间且无特殊条件,因此第二个单元格通过加8小时得到:
15:00 + 8 小时 = 23:00
- 2025年3月31日23:00为非工作时间且不满足任何条件,第三个单元格为:
23:00 + 8 小时 = 7:00
-
2025年4月1日07:00为非工作时间且小于8:00(语句3),下一个单元格按如下方式计算:
- diff = 08:00 - 07:00 = 1 小时
- diff * inc = 1 小时 * 1 = 1 小时
- 07:00 + 1 小时 = 08:00
2025年4月1日08:00与最早任务的开始时间相同。
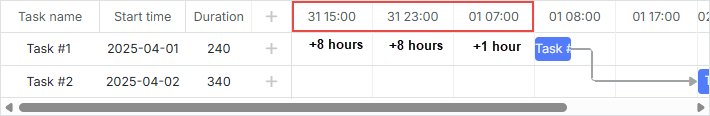
其他单元格的创建方式类似。
当 skip_off_time 被禁用时,Gantt 可能会在最早任务前添加多个空单元格。为了确保无论该设置如何,始终只出现一个单元格,可以使用如下逻辑:
gantt.date.add_day_custom = function (date, inc) {
    // 当 work_time 启用且任务已加载时,计算第一个单元格的日期。
    // 从最小日期开始,向后查找,找到最近的工作时间日期,
    // 然后再减去1小时
    if (inc < 0 && gantt.getTaskByTime().length) {
        return gantt.calculateEndDate({
            start_date: date, duration: -1, unit: gantt.config._duration_unit
        })
    }

    // 工作日开始
    // 计算工作日结束时间
    if (date.getHours() == 8) {
        return gantt.calculateEndDate(date, 8);
    }
    // 工作日结束
    // 计算下一个工作日的开始时间
    if (date.getHours() == 17) {
        return gantt.date.add(date, 15 * inc, "hour");
    }

    // 如果任务已加载,计算第二个刻度单元格的工作日期
    // 如果没有任务,则计算所有刻度单元格的日期
    date = gantt.date.add(date, 1 * inc, "day");
    gantt.date.day_start(date);
    date = gantt.getClosestWorkTime({ date, dir: "future" })
    return date
};

gantt.config.scales = [
    { unit: "day_custom", step: 1, date: "%d %H:%i" },
];
gantt.config.work_time = true;

gantt.config.skip_off_time = false; /*!*/
Related example: Equal offset for custom scales
当隐藏非工作小时后,刻度显示如下:
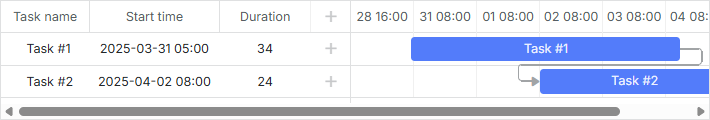
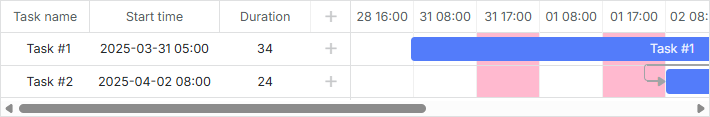
当显示非工作小时(gantt.config.skip_off_time 被禁用)时,视图如下:
无限滚动
有关在时间线中实现无限滚动的详细示例,请参见相关文章。
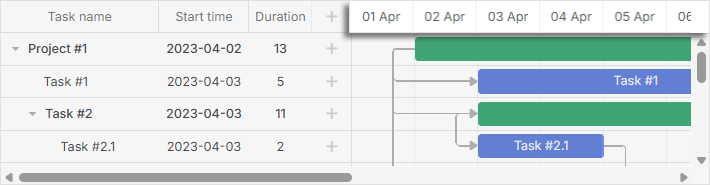
粘性标签
从9.0版本开始,时间刻度标签默认具有粘性。这意味着当单元格宽度远大于其标签时,标签会在你滚动时间线时保持可见,并一直粘附在视口上,直到自然滚动离开。这有助于在缩放时保持刻度标签的可见性。
如果你更喜欢以前标签居中且滚动时不会粘附的行为,可以通过将刻度的 sticky 属性设置为 false 来禁用粘性标签:
gantt.config.scales = [
  {unit: "year", step: 1, format: "%Y", sticky: false},
  {unit: "month", step: 1, format: "%F", sticky: false},
  {unit: "day", step: 1, format: "%j", sticky: false}
];
gantt.init("gantt_here");
或者,要强制某一级刻度标签始终粘性显示,无论单元格宽度如何,可以设置 sticky: true。这样即使标签宽度小于单元格宽度,也会一直粘附显示:
gantt.config.scales = [
  {unit: "year", step: 1, format: "%Y", sticky: true},
  {unit: "month", step: 1, format: "%F", sticky: true},
  {unit: "day", step: 1, format: "%j", sticky: true}
];
gantt.init("gantt_here");