dhtmlxGantt with dhtmlxConnector
This tutorial will teach you how to create a basic Gantt chart on a page that will be able to save and update tasks in the database (i.e. on the server).
The current tutorial is intended for creating Gantt with dhtmlxConnector. If you want to use some server-side technology instead, check the list of tutorials describing available integration variants below:
- dhtmlxGantt with ASP.NET MVC
- dhtmlxGantt with Node.js
- dhtmlxGantt with Python
- dhtmlxGantt with PHP:Slim3
- dhtmlxGantt with PHP: Laravel
- dhtmlxGantt with Salesforce LWC
- dhtmlxGantt with Ruby on Rails
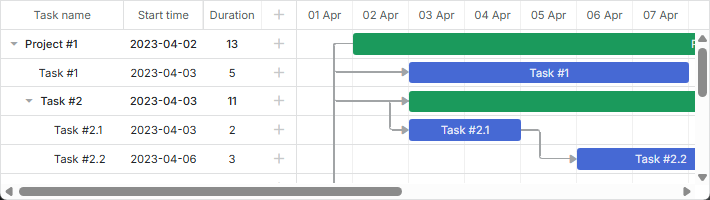
Related sample: Basic initialization
Step 1. Downloading dhtmlxGantt Package
Let's start the tutorial with getting the library package on your computer.
Do the following:
- Download the dhtmlxGantt package here, if you haven't done it yet.
- Extract the package to the root directory of your local web server. The extracted files will be stored in a folder with the same name as the package file - dhtmlxGantt.
Step 2. Including dhtmlxGantt Code Files
Then, we need to include dhtmlxGantt code files in your HTML file (to be able to use the functionality of the library). The dhtmlxGantt code files are:
dhtmlxgantt.jsdhtmlxgantt.css
Do the following:
- Create an HTML file in the
dhtmlxGanttfolder (the folder with the dhtmlxGantt files). Name it, for example,myGantt.html. - Include dhtmlxGantt code files to myGantt.html (both files reside in the
codebasefolder). See myGantt.html:
<!DOCTYPE html>
<html>
<head>
  <title>How to Start with dhtmlxGantt</title>
  <script src="codebase/dhtmlxgantt.js"></script> <!-- important -->
  <link href="codebase/dhtmlxgantt.css" rel="stylesheet"> <!-- important -->
</head>
<body>
  <!-- your code will be here -->
</body>
</html>
Step 3. Initializing dhtmlxGantt
Then, we need to create a DIV container and initialize dhtmlxGantt in it.
Beware, dhtmlxGantt is a static object and can be instantiated on the page once. To refer to the dhtmlxGantt's instance you can use dhtmlxGantt or simply gantt.
- Define a DIV container in the myGantt.html file.
- Initialize dhtmlxGantt with the
gantt.init("gantt_here")command.
As a parameter, the method takes an HTML container where a Gantt chart will be placed.
<!DOCTYPE html>
<html>
<head>
   <title>How to Start with dhtmlxGantt</title>
   <script src="codebase/dhtmlxgantt.js"></script>
   <link href="codebase/dhtmlxgantt.css" rel="stylesheet">
</head>
<body>
	<div id="gantt_here" style='width:1000px; height:400px;'></div>
    <script type="text/javascript">
		gantt.init("gantt_here"); /*!*/
	</script>
</body>
</html>
Note, if you use the full-screen mode, specify the current style to guarantee correct behavior:
<style type="text/css" media="screen">
    html, body{
        margin:0px;
        padding:0px;
        height:100%;
        overflow:hidden;
    }
</style>
Step 4. Loading Data to the Gantt Chart
Then, we need to populate the Gantt chart with the data from a sample data source. We will use the easiest of the ways and specify the data source as an inline object. To load data, we will use the parse method that takes the name of the data source as a parameter. The properties of the object are:
- data - specifies the gantt tasks
- id - (string, number) the event id.
- start_date - (Date) the date when an event is scheduled to begin.
- text - (string) the task description.
- progress - (number) a number from 0 to 1 that shows what percent of the task is complete.
- duration - (number) the task duration in the units of the current time scale.
- parent - (number) the id of the parent task.
- links - specifies the gantt dependency links
- id-(string, number) the event id.
- source-(number) the id of the source task.
- target-(number) the id of the target task.
- type-(string) the type of the dependency: 0 - 'finish to start', 1 - 'start to start', 2 - 'finish to finish'.
Declare the 'tasks' variable in the myGantt.html file:
var tasks = {
    data:[
        {id:1, text:"Project #1",start_date:"01-04-2013", duration:11,
        progress: 0.6, open: true},
        {id:2, text:"Task #1",     start_date:"03-04-2013", duration:5,
        progress: 1,   open: true, parent:1},
        {id:3, text:"Task #2",   start_date:"02-04-2013", duration:7,
        progress: 0.5, open: true, parent:1},
        {id:4, text:"Task #2.1", start_date:"03-04-2013", duration:2,
        progress: 1,   open: true, parent:3},
        {id:5, text:"Task #2.2", start_date:"04-04-2013", duration:3,
        progress: 0.8, open: true, parent:3},
        {id:6, text:"Task #2.3", start_date:"05-04-2013", duration:4,
        progress: 0.2, open: true, parent:3}
    ],
    links:[
        {id:1, source:1, target:2, type:"1"},
        {id:2, source:1, target:3, type:"1"},
        {id:3, source:3, target:4, type:"1"},
        {id:4, source:4, target:5, type:"0"},
        {id:5, source:5, target:6, type:"0"}
    ]
};
Call the gantt.parse(tasks) command after the gantt.init("gantt_here") line:
gantt.init("gantt_here");
gantt.parse (tasks);/*!*/
Related sample: Basic initialization
Step 5. Creating a Database
Read this and further steps if you want to load data from a database instead of from an inline object.
Then, we need to create a database with 2 tables to store tasks and dependencies. sortorder is a property used only while loading data from a database. The property sets the index of a task among siblings. Do the following: Create a new database with the name - gantt. Execute the following code to create 2 tables in it: gantt_tasks and gantt_links.
CREATE TABLE `gantt_links` (
  `id` int(11) NOT NULL AUTO_INCREMENT,
  `source` int(11) NOT NULL,
  `target` int(11) NOT NULL,
  `type` varchar(1) NOT NULL,
  PRIMARY KEY (`id`)
);

CREATE TABLE `gantt_tasks` (
  `id` int(11) NOT NULL AUTO_INCREMENT,
  `text` varchar(255) NOT NULL,
  `start_date` datetime NOT NULL,
  `duration` int(11) NOT NULL DEFAULT 0,
  `progress` float NOT NULL DEFAULT 0,
  `sortorder` int(11) NOT NULL DEFAULT 0,
  `parent` int(11) NOT NULL,
  PRIMARY KEY (`id`)
);
To be able to save tasks in the database when some column has an empty value, add the following code to the myGantt.html file:
gantt.attachEvent("onBeforeTaskAdd", function(id,task){
    task.sortorder = 0;
    return true;
});
Step 6. Loading Data from the Database
Then, we need to provide the ability to display data from the database in the chart. We'll do it with the load method, that takes the URL to the data source as a parameter. In case of a database, it's a PHP file which realizes connection to the server side. We will use the PHP platform and the dhtmlxConnector library, as this is the easiest way to implement the server-side logic for dhtmlxGantt. Do the following: Create a PHP file in the 'dhtmlxGantt' folder and name it, for example, data.php. Open the data.php file and add the following server-side code to it:
<?php

include ('codebase/connector/gantt_connector.php');

$res = new PDO("mysql:host=localhost;dbname=gantt", "root", "");

$gantt = new JSONGanttConnector($res);
$gantt->render_links("gantt_links","id","source,target,type");
$gantt->render_table(
    "gantt_tasks",
    "id",
    "start_date,duration,text,progress,sortorder,parent"
);
?>
Switch to the myGantt.html file and set the gantt.config.date_format property to "%Y-%m-%d %H:%i", to make the format of output data compatible with the format of dhtmlxGantt.
gantt.config.date_format = "%Y-%m-%d %H:%i";/*!*/
gantt.init("gantt_here");
Call the gantt.load('data.php') command to load data from the database to the Gantt chart.
gantt.config.date_format = "%Y-%m-%d %H:%i";
gantt.init("gantt_here");
gantt.load('data.php');//loads data to Gantt from the database  /*!*/
Mapping database columns
Please note that the order of columns in $connector->render_table is important. The first three columns in the columns list are mapped to start_date/duration/text or start_date/end_date/text properties of the client-side task object respectively, no matter what column names you specify. The logic of mapping columns is described below.
The second column is mapped to task.duration, if you specify 'duration' in the configuration:
$gantt->render_table("gantt_tasks","id","Start,duration,Name,progress,parent","");
or, using alias:
$gantt->render_table("gantt_tasks","id","Start,Length(duration),Name,progress,parent","");
// JS: task.start_date, task.duration, task.text, task.progress, task.parent
If any other column name is set, the second column will be mapped to the end_date property:
$gantt->render_table("gantt_tasks","id","Start,End,Name,progress,parent","");
// JS: task.start_date, task.end_date, task.text, task.progress, task.parent
Mapping other columns
All other columns will be mapped by their names without changes:
$gantt->render_table("gantt_tasks","id","start_date,duration,text,custom,parent","");
// JS: task.start_date, task.duration, task.text, task.custom, task.parent
Aliases can be used for other columns as well:
$gantt->render_table("gantt_tasks","id",
    "start_date,duration,text,custom_column(customProperty),parent","");
// JS: task.start_date, task.duration, task.text, task.customProperty, task.parent
Step 7. Updating Data in the Database
Then, we need to provide the ability to save the changes made in the Gantt chart to the database. For this purpose, we'll use the helper library. All we need to do is to initialize DataProcessor and attach it to the dhtmlxGantt object.
Do the following:Open the myGantt.html file and initialize dhtmlxDataProcessor with the dataProcessor("data.php") command.
Attach the dhtmlxDataProcessor object to the dhtmlxGantt object with the dp.init(gantt) command.
gantt.init("gantt_here");
gantt.load('data.php');

var dp="new" gantt.dataProcessor("data.php"); /*!*/
dp.init(gantt); /*!*/
Logging errors
In case you've completed the above steps but something still is not working, enable logging in Gantt to detect an error.
First of all, make sure, that there are write permissions on the directory where the HTML file is located. Then add the following line into the data.php file:
$gantt = new JSONGanttConnector($res);

$gantt->enable_log("log.txt"); /*!*/
After that, you can view logs in the log.txt file.
What's Next?
That's all. A basic but functional Gantt chart that can load data from the database and save it back is ready. Now you may configure and customize it to meet all your needs.
We recommend you to read these articles as your next step: