dhtmlxGantt와 dhtmlxConnector 사용하기
이 튜토리얼은 웹페이지에 간단한 Gantt 차트를 설정하고, 해당 차트에서 작업을 데이터베이스(서버)에 저장 및 업데이트하는 방법을 설명합니다.
여기서는 dhtmlxConnector를 사용하여 Gantt 차트를 구축하는 방법에 중점을 둡니다. 다른 서버 사이드 기술을 선호하는 경우, 아래에서 다양한 통합 옵션에 대한 튜토리얼을 확인할 수 있습니다:
- dhtmlxGantt와 PHP: Laravel 연동
- dhtmlxGantt와 PHP:Slim3 사용하기
- dhtmlxGantt와 Python
- dhtmlxGantt와 Node.js 연동하기
- dhtmlxGantt와 ASP.NET MVC
- dhtmlxGantt와 Salesforce LWC 연동하기
- dhtmlxGantt와 Ruby on Rails 연동하기
Related sample: Basic initialization
1단계. dhtmlxGantt 패키지 다운로드
먼저, 라이브러리 패키지를 컴퓨터에 다운로드합니다.
 다음 단계를 따르세요:
- 아직 다운로드하지 않았다면, 여기에서 dhtmlxGantt 패키지를 다운로드하세요.
- 패키지 압축을 로컬 웹서버의 루트 디렉토리에 해제하세요. 압축 해제된 파일들은 패키지 파일명과 동일한 폴더(dhtmlxGantt)에 저장됩니다.
2단계. dhtmlxGantt 코드 파일 포함하기
다음으로, dhtmlxGantt의 기능을 사용하기 위해 HTML 파일에 코드 파일을 포함해야 합니다. 필수 dhtmlxGantt 코드 파일은 다음과 같습니다:
- dhtmlxgantt.js
- dhtmlxgantt.css
다음 단계를 따르세요:- 'dhtmlxGantt' 폴더(즉, dhtmlxGantt 파일들이 위치한 곳)에 HTML 파일을 생성하세요. 예를 들어, 'myGantt.html'로 이름을 지정할 수 있습니다.
- myGantt.html에서 dhtmlxGantt 코드 파일을 포함하세요(두 파일 모두 'codebase' 폴더에 있습니다).
myGantt.html
<!DOCTYPE html>
<html>
<head>
   <title>How to Start with dhtmlxGantt</title>
   <script src="codebase/dhtmlxgantt.js"></script>      <link href="codebase/dhtmlxgantt.css" rel="stylesheet">   </head>
<body>
    //your code will be here
</body>
</html>
3단계. dhtmlxGantt 초기화하기
그 다음, DIV 컨테이너를 생성하고 그 안에 dhtmlxGantt를 초기화합니다.
dhtmlxGantt는 정적 객체이므로 한 페이지에 한 번만 인스턴스화할 수 있습니다.
dhtmlxGantt 인스턴스는 dhtmlxGantt 또는 gantt로 참조할 수 있습니다.
다음 단계를 따르세요:- myGantt.html 파일에 DIV 컨테이너를 추가하세요.
gantt.init("gantt_here")명령으로 dhtmlxGantt를 초기화하세요. 이 메서드는 Gantt 차트가 렌더링될 HTML 컨테이너의 ID를 인자로 받습니다.
myGantt.html
<!DOCTYPE html> <html> <head> <title>How to Start with dhtmlxGantt</title> <script src="codebase/dhtmlxgantt.js"></script> <link href="codebase/dhtmlxgantt.css" rel="stylesheet"> </head> <body> <div id="gantt_here" style='width:1000px; height:400px;'></div> <script type="text/javascript">
gantt.init("gantt_here");</script> </body> </html>
전체 화면 모드를 사용하는 경우, 아래 CSS를 추가하여 정상적으로 표시되도록 하세요:
<style type="text/css" media="screen">    html, body{
        margin:0px;
        padding:0px;
        height:100%;
        overflow:hidden;
    }
</style>
4단계. Gantt 차트에 데이터 불러오기
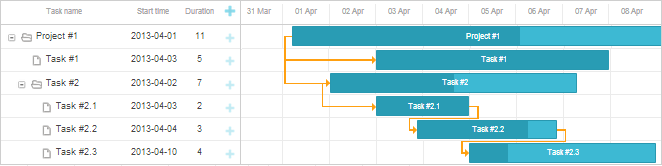
이제 샘플 데이터 소스에서 Gantt 차트를 채워보겠습니다. 여기서는 인라인 객체를 데이터 소스로 사용하여 간단하게 설명합니다.
데이터를 불러오기 위해 parse 메서드를 사용하며, 데이터 소스를 파라미터로 전달합니다.
객체의 속성은 다음과 같습니다:
- data - Gantt 작업 목록을 담고 있습니다.
- id - (string, number) 고유 작업 식별자
- start_date - (Date) 작업 시작 예정일
- text - (string) 작업 설명
- progress - (number) 0에서 1 사이의 값으로 작업의 완료율
- duration - (number) 현재 시간 단위로 작업 기간
- parent - (number) 상위 작업의 ID(있을 경우)
- links - 작업 간의 종속성 정의
- id-(string, number) 고유 링크 식별자
- source-(number) 소스 작업의 ID
- target-(number) 대상 작업의 ID
- type-(string) 종속성 유형: 0 - 'finish to start', 1 - 'start to start', 2 - 'finish to finish'
다음 단계를 따르세요:- myGantt.html 파일에 'tasks' 변수를 선언하세요:
myGantt.html
var tasks = {
    data:[
        {id:1, text:"Project #1",start_date:"01-04-2013", duration:11,
        progress: 0.6, open: true},
        {id:2, text:"Task #1",   start_date:"03-04-2013", duration:5,
        progress: 1,   open: true, parent:1},
        {id:3, text:"Task #2",   start_date:"02-04-2013", duration:7,
        progress: 0.5, open: true, parent:1},
        {id:4, text:"Task #2.1", start_date:"03-04-2013", duration:2,
        progress: 1,   open: true, parent:3},
        {id:5, text:"Task #2.2", start_date:"04-04-2013", duration:3,
        progress: 0.8, open: true, parent:3},
        {id:6, text:"Task #2.3", start_date:"05-04-2013", duration:4,
        progress: 0.2, open: true, parent:3}
    ],
    links:[
        {id:1, source:1, target:2, type:"1"},
        {id:2, source:1, target:3, type:"1"},
        {id:3, source:3, target:4, type:"1"},
        {id:4, source:4, target:5, type:"0"},
        {id:5, source:5, target:6, type:"0"}
    ]
};
gantt.init("gantt_here")바로 뒤에gantt.parse(tasks)명령을 추가하세요:
myGantt.html
gantt.init("gantt_here");
gantt.parse (tasks);
Related sample: Basic initialization
5단계. 데이터베이스 생성
이 단계와 이후 단계는 인라인 데이터가 아닌 데이터베이스에서 데이터를 불러오고자 할 때 적용됩니다.
다음으로, 작업과 종속성을 저장할 두 개의 테이블이 있는 데이터베이스를 설정합니다.
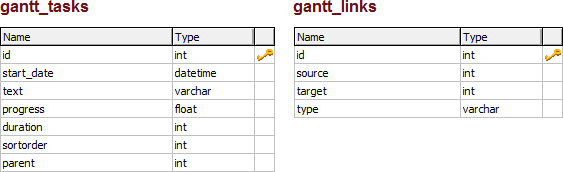
sortorder는 데이터베이스에서 데이터를 불러올 때만 사용되는 속성입니다. 형제 작업 간의 순서를 결정합니다.
다음 단계를 따르세요:- gantt라는 이름의 새 데이터베이스를 생성하세요.
- 아래 SQL 코드를 실행하여 gantt_tasks와 gantt_links 테이블을 생성하세요:
CREATE TABLE `gantt_links` (
  `id` int(11) NOT NULL AUTO_INCREMENT,
  `source` int(11) NOT NULL,
  `target` int(11) NOT NULL,
  `type` varchar(1) NOT NULL,
  PRIMARY KEY (`id`)
);

CREATE TABLE `gantt_tasks` (
  `id` int(11) NOT NULL AUTO_INCREMENT,
  `text` varchar(255) NOT NULL,
  `start_date` datetime NOT NULL,
  `duration` int(11) NOT NULL DEFAULT 0,
  `progress` float NOT NULL DEFAULT 0,
  `sortorder` int(11) NOT NULL DEFAULT 0,
  `parent` int(11) NOT NULL,
  PRIMARY KEY (`id`)
);
일부 필드가 비어 있어도 작업이 정상적으로 저장되도록, myGantt.html 파일에 아래 코드를 추가하세요:
myGantt.html
gantt.attachEvent("onBeforeTaskAdd", function(id,task){
    task.sortorder = 0;
    return true;
});
6단계. 데이터베이스에서 데이터 불러오기
다음 두 단계에서는 서버-클라이언트 통합을 위해 PHP를 사용합니다.
다른 플랫폼을 사용하는 경우, 서버 스크립트 구현 방법은 데이터 로딩 문서를 참고하세요.
이제 데이터베이스에서 차트로 데이터를 불러올 수 있도록 하겠습니다. 이 작업은 데이터 소스의 URL을 인자로 받는 load 메서드로 수행합니다.
데이터베이스 접근을 위해 이 URL은 서버 사이드 로직을 처리하는 PHP 파일을 가리킵니다.
여기서는 PHP와 dhtmlxConnector 라이브러리를 사용합니다. 이 라이브러리는 dhtmlxGantt의 서버 사이드 통합을 간소화합니다.
다음 단계를 따르세요:- 'dhtmlxGantt' 폴더 내에 PHP 파일을 생성하세요(예: data.php).
- data.php를 열고 다음 서버 사이드 코드를 추가하세요:
data.php
<?php

include ('codebase/connector/gantt_connector.php');

$res = new PDO("mysql:host=localhost;dbname=gantt", "root", "");

$gantt = new JSONGanttConnector($res);
$gantt->render_links("gantt_links","id","source,target,type");
$gantt->render_table(
    "gantt_tasks",
    "id",
    "start_date,duration,text,progress,sortorder,parent"
);
?>
- myGantt.html 파일에서
gantt.config.date_format속성을 "%Y-%m-%d %H:%i"로 설정하여 날짜 형식이 dhtmlxGantt에서 기대하는 형식과 일치하도록 하세요.
myGantt.html
gantt.config.date_format = "%Y-%m-%d %H:%i"; gantt.init("gantt_here");
gantt.load('data.php')를 호출하여 데이터베이스에서 Gantt 차트로 데이터를 불러옵니다.
myGantt.html
gantt.config.date_format = "%Y-%m-%d %H:%i";
gantt.init("gantt_here");
gantt.load('data.php');//loads data to Gantt from the database
데이터베이스 컬럼 매핑
$connector->render_table에서 컬럼의 순서가 중요하다는 점을 기억하세요. 목록의 처음 세 개 컬럼은 사용한 컬럼명과 관계없이 항상 클라이언트 측 task 객체의 start_date/duration/text 혹은 start_date/end_date/text 속성과 매핑됩니다. 매핑 로직은 아래에 설명되어 있습니다.
두 번째 컬럼은 설정에서 'duration'이 명시되어 있으면 task.duration에 할당됩니다:
$gantt->render_table("gantt_tasks","id","Start,duration,Name,progress,parent","");
또는, 별칭(alias)을 사용할 수도 있습니다:
$gantt->render_table("gantt_tasks","id","Start,Length(duration),Name,progress,parent","");
// JS: task.start_date, task.duration, task.text, task.progress, task.parent
다른 컬럼명이 사용된 경우, 두 번째 컬럼은 end_date 속성과 연결됩니다:
$gantt->render_table("gantt_tasks","id","Start,End,Name,progress,parent","");
// JS: task.start_date, task.end_date, task.text, task.progress, task.parent
기타 컬럼 매핑
나머지 컬럼들은 이름 그대로 직접적으로 매핑됩니다:
$gantt->render_table("gantt_tasks","id","start_date,duration,text,custom,parent","");
// JS: task.start_date, task.duration, task.text, task.custom, task.parent
다른 컬럼에도 별칭을 적용할 수 있습니다:
$gantt->render_table("gantt_tasks","id",
    "start_date,duration,text,custom_column(customProperty),parent","");
// JS: task.start_date, task.duration, task.text, task.customProperty, task.parent
7단계. 데이터베이스에 데이터 업데이트하기
다음으로, Gantt 차트에서 변경된 내용을 데이터베이스에 저장할 수 있도록 해야 합니다. 이를 위해 dataProcessor 헬퍼 라이브러리를 사용합니다. 과정은 DataProcessor를 초기화하고 dhtmlxGantt 인스턴스에 연결하는 것으로 진행됩니다.
실행 방법:- myGantt.html 파일을 열어
dataProcessor("data.php")명령어로 새로운 dhtmlxDataProcessor 인스턴스를 생성하세요. dp.init(gantt)를 사용하여 dhtmlxDataProcessor 객체를 dhtmlxGantt 인스턴스에 연결하세요.
myGantt.html
gantt.init("gantt_here");
gantt.load('data.php');

var dp=new gantt.dataProcessor("data.php");  dp.init(gantt);
오류 로깅
모든 설정이 완료되었는데도 문제가 발생한다면, Gantt에서 로깅을 활성화하여 문제를 진단할 수 있습니다.
먼저, HTML 파일이 위치한 디렉터리에 쓰기 권한이 있는지 확인하세요. 그런 다음, data.php 파일에 아래 라인을 추가하세요:
data.php
$gantt = new JSONGanttConnector($res);

$gantt->enable_log("log.txt");
이후 log.txt 파일을 확인하여 기록된 정보를 검토할 수 있습니다.
다음 단계는?
이제 데이터베이스에서 데이터를 불러오고 변경사항을 저장할 수 있는 기본 Gantt 차트가 완성되었습니다. 이제 필요에 맞게 조정 및 확장할 수 있습니다.
추가 안내가 필요하다면 다음 문서를 참고하세요:
Back to top