histogram_cell_capacity
This functionality is available in the PRO edition only.
Description
Specifies the height of the line that defines the available capacity of the resource
histogram_cell_capacity: (start_date: Date, end_date: Date, resource: any, tasks: Array<Task>, assignments: any[]) => number | void;
Parameters
start_date- (required) Date - start date of the scale cellend_date- (required) Date - end date of the scale cellresource- (required) object - the resource objecttasks- (required) Array - <Task> tasks that are assigned to the specified resource and overlap start/end dates of the cellassignments- (required) array - resource assignments that are assigned to the specified start/end dates of the task
Returns
height- (number | void) - the height of the line that defines the available capacity of the resource
Example
gantt.templates.histogram_cell_capacity=function(start_date,end_date,resource,tasks,
    assignments){
    return 24;
};
Related Samples
Details
The value of the template can be set from -1 to maxCapacity. Values less than 0 won't render the line.
maxCapacity definition
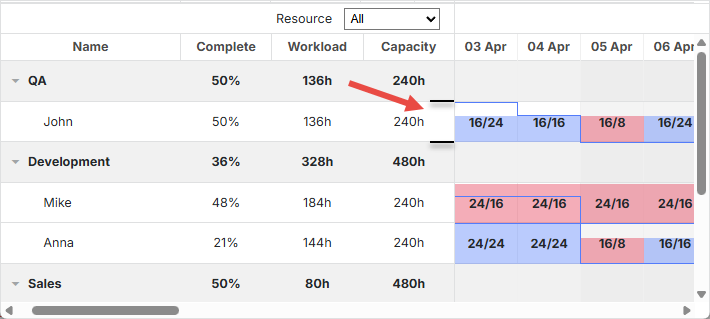
If each row of the histogram is considered as a bar chart, maxCapacity is the height of the Y-scale of this chart. In the image below maxCapacity = 24:
By default, maxCapacity is 24 for all resources. It means that if you return the value bigger than 24 in the histogram_cell_capacity template, the numbers will be calculated correctly, but the area of the cells of the resource panel may not be filled as you expected.

But there is the ability to configure maxCapacity for all histogram at once and for each resource separately. Check the example below:
https://snippet.dhtmlx.com/glnqcsgq Configuring maxCapacity
Related API
- histogram_cell_class
- histogram_cell_label
- histogram_cell_allocated
- process_resource_assignments
- resource_property
Related Guides
Change log
- the assignments parameter is added in v7.1