Integration with Vue.js
You can use dhtmlxPivot in an application created with the Vue.js framework.
This tutorial will help you to understand the basic principle of using dhtmlxPivot in an application based on Vue.js.
Initializing a project
Note, that the sample provided below is not the only way to use dhtmlxPivot in a Vue.js-based application. It gives you initial schema of the integration and implies further extension of the app functionality depending on your requirements.
Creating a project
Let's begin with creating our project.
At first, you need to install Vue CLI:
npm install -g @vue/cli
// or
yarn global add @vue/cli
and create a new "vue-pivot-app" project folder by running the following command:
vue create vue-pivot-app
Once everything is done, you can go to the app directory and run the application:
cd vue-pivot-app

npm run serve
//or
yarn serve
After that, open a new http://localhost:8080/ browser tab and you'll see the default Vue.js page:

Adding Pivot to the page
At this step, we'll add a pivot populated with data to the page of our app. It presupposes several sub-steps, described below.
1. Install the "from-cdn" package to be able to include source files of dhtmlxPivot into our app directly. For that, go to your project directory and call the command below:
npm i from-cdnFor more information on from-cdn, follow the link.
2. Create the vue-pivot-app/src/assets/dataset.json file with static data for loading into your Pivot (see the example on Github).
3. Then, create the vue-pivot-app/src/components/Pivot.vue file with the code like this:
vue-pivot-app/src/components/Pivot.vue
<template>
    <div class="dhx_sample-container__widget" ref="pivot"></div>
</template>

<script>
import fromCDN from "from-cdn";
import dataset from "../assets/dataset.json";

export default {
    name: "Pivot",
    data: () => ({
        pivot: null,
        fields: {
            rows: ["form", "name"],
            columns: ["year"],
            values: [
                { id: "oil", method: "count" },
                { id: "oil", method: "sum" },
            ],
        },
        fieldList: [
            { id: "name", label: "Name" },
            { id: "year", label: "Year" },
            { id: "continent", label: "Continent" },
            { id: "form", label: "Form" },
            { id: "gdp", label: "GDP" },
            { id: "oil", label: "Oil" },
            { id: "balance", label: "Balance" },
            { id: "when", label: "When", type: "date", format: "%d/%m/%Y" },
        ],
        layout: {
            footer: true,
        },
    }),
    mounted() {
        fromCDN([
            "https://cdn.dhtmlx.com/pivot/pro/edge/pivot.js",
            "https://cdn.dhtmlx.com/pivot/pro/edge/pivot.css"
        ]).then(() => {
            // eslint-disable-next-line no-undef
            this.pivot = new dhx.Pivot(this.$refs.pivot, {
                data: dataset,
                fields: this.fields,
                fieldList: this.fieldList,
                layout: this.layout
            });
        });
    },
    beforeDestroy() {
        if (this.pivot) {
            this.pivot.destructor();
        }
    },
};
</script>

<style scoped>
.dhx_sample-container__widget {
    height: 100vh;
    width: 100vw;
}
</style>
4. Finally, open the App.vue file and update its code with the following:
vue-pivot-app/src/App.vue
<template>
    <div>
        <Pivot />
    </div>
</template>

<script>
import Pivot from './components/Pivot.vue'

export default {
    name: 'App',
    components: {
        Pivot
    }
}
</script>
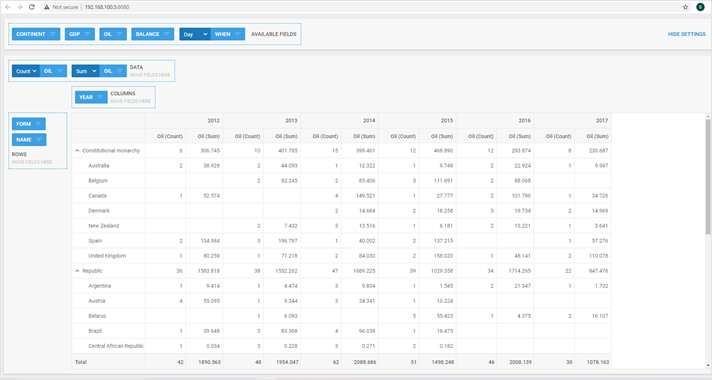
Now everything is ready. Let's run our application. Open http://localhost:8080/ to see Pivot that we've just created.

You can view the code on GitHub, clone or download it and use it for your projects.
Pivot Customization
Let's customize look and feel of the created Pivot.
To do that, open the Pivot.vue file, add the new mark method and define styles for .mark, .customMaxCell, .biggestMaxCell classes:
<template>
    <div class="dhx_sample-container__widget" ref="pivot"></div>
</template>

<script>
import fromCDN from "from-cdn";
import dataset from "../assets/dataset.json";

export default {
    name: "Pivot",
    data: () => ({
        pivot: null,
        fields: {
            rows: ["form", "name"],
            columns: ["year"],
            values: [
                { id: "oil", method: "count" },
                { id: "oil", method: "max" },
            ],
        },
        fieldList: [
            { id: "name", label: "Name" },
            { id: "year", label: "Year" },
            { id: "continent", label: "Continent" },
            { id: "form", label: "Form" },
            { id: "gdp", label: "GDP" },
            { id: "oil", label: "Oil" },
            { id: "balance", label: "Balance" },
            { id: "when", label: "When", type: "date", format: "%d/%m/%Y" },
        ],
        layout: {
            footer: true,
        },
        mark: function (cell, columnData, row, column) {             if (column.method === "max") {                 var max = Math.max.apply(null, columnData);                 if (max === parseFloat(cell)) {                     return "biggestMaxCell";                 }                 return "customMaxCell";             }             if (cell < 10 && cell !== null) {                 return "mark";             }             return false;         }     }),
    mounted() {
        fromCDN([
            "https://cdn.dhtmlx.com/pivot/pro/edge/pivot.js",
            "https://cdn.dhtmlx.com/pivot/pro/edge/pivot.css"
        ]).then(() => {
            // eslint-disable-next-line no-undef
            this.pivot = new dhx.Pivot(this.$refs.pivot, {
                data: dataset,
                fields: this.fields,
                fieldList: this.fieldList,
                layout: this.layout,
                mark: this.mark             });
        });
    },
    beforeDestroy() {
        if (this.pivot) {
            this.pivot.destructor();
        }
    },
};
</script>

<style>
.dhx_sample-container__widget {
    height: 100vh;
    width: 100vw;
}

/* for custom mark */
.mark {     background: #757575;     color: #fff; } .customMaxCell {     background: #ffd6d6; } .biggestMaxCell {     background: #fa9595; } </style>
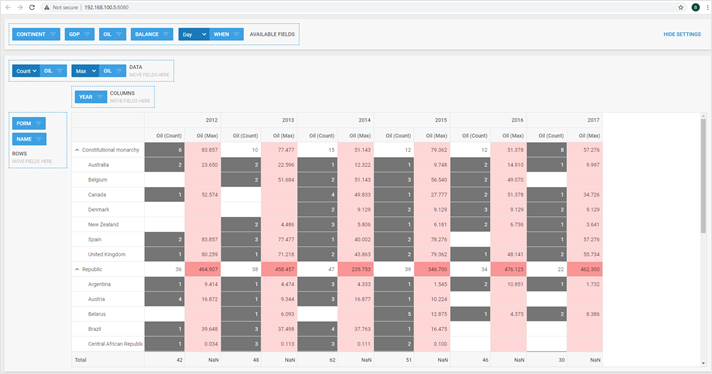
That's all. Open http://localhost:8080/ and you will see a nice Pivot with colored cells on the page:

What's next
Check more samples in the DHTMLX Vue.js-Pivot demo. Looking at the code, you will find that all samples are created in a similar way. You can also easily add your own code or our sample into a Vue.js-based app.
You can find samples of dhtmlxPivot here.
Back to top