dhtmlxPivot Overview
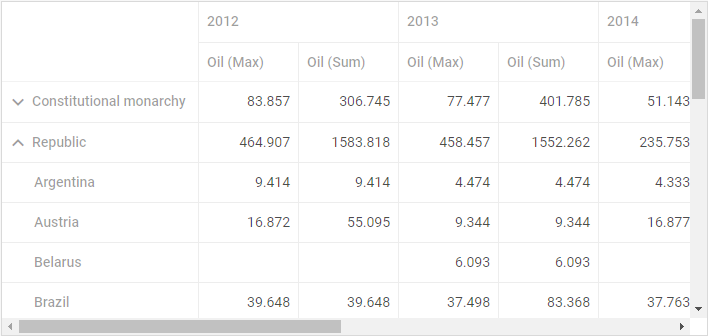
dhtmlxPivot is a component that presents a client-side grid which is able to quickly analyze data from large datasets and render the result in a detailed but compact way. It lets compare and sort complex data within one table and easily adjust the scheme of data analysis.
In this article you will explore the complex structure of DHTMLX Pivot for better understanding of its functionality.
Main Parts and Their Roles
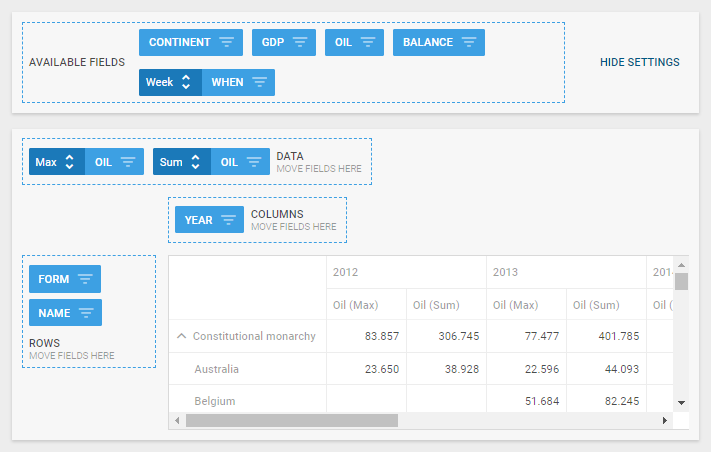
There are two main parts:
- a grid with configurable columns and rows

- a configuration area

This area consists of four sections:
- a header with available fields and a button for showing/hiding the configuration area
- a panel that contains fields that will be used as Pivot data
- a panel with fields for rows
- a panel with fields for columns
Elements (fields) presented in the above described sections correlate to data item properties from the dataset.
{
    "name": "Argentina",
    "year": 2005,
    "continent": "South America",
    "form": "Republic",
    "gdp": 181.357,
    "oil": 1.545,
    "balance": 4.699,
    "when": "10.10.10"
}
You can set them to some of the sections initially or drag fields between sections to change the Pivot structure dynamically.
Let's have a deeper look at the sections:
- the Available Fields section contains all data properties from the dataset (e.g. "name", "year", "continent" from the example below), except for those that are already placed into the Rows and Columns sections
- the Columns section includes fields that define the upper headers of the datatable
- the Rows section contains fields that define the left-hand treetable
- the fields set or dragged to the Data section specify the bottomost header of the datatable and define what data should be loaded into Pivot
Related sample: Initialization
Data Operations
The current data operations are specified next to the data values in the Data section. You can choose the neccessary operation by clicking a toggle next to the corresponding data field.

There are four types of data operations you can choose from:
- Sum - sums all the values of the selected data property and displays the sum
- Min - finds and displays the minimum value of the selected data property
- Max - finds and displays the maximum value of the selected data property
- Count - looks for all the occurrences of the selected data property and displays their number
Related sample: Initialization
What's Next
To start working with dhtmlxPivot, follow the step-by-step How to Start tutorial.
Back to top