Legend
Legends are used to provide information about the charts shown on the page and tell you what each bar, line etc. represents.
Starting from version 4.0, legends get interactivity: each click on a legend item removes/adds the related data series (the first click - removes, the second - adds, the third - removes and so on).
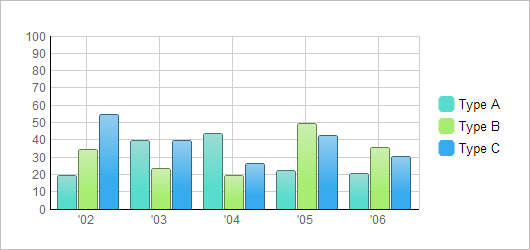
Here is a small example which demonstrates how to create and configure the legend:
var barChart =  new dhtmlXChart({
    view:"bar",
    container:"chartBox",
        value:"#sales1#",
        color: "#58dccd",
    xAxis:{ template:"'#year#"},
    legend:{
        values:[
            {text:"Type A",color:"#58dccd"},
            {text:"Type B",color:"#a7ee70"},
            {text:"Type C",color:"#36abee"}
        ],
        valign:"middle",
        width:90,
        layout:"y"
    }
});
barChart.addSeries({ value:"#sales2#", color:"#a7ee70" });
barChart.addSeries({ value:"#sales3#", color:"#36abee" });
barChart.parse(mydataset,"json");
First of all, the legend is specified through the legend parameter.
- values defines legend items (text - the item text label, color - the item color, markerType - the marker type, toggle - enables/disables the possibility to hide/show a specific graph by clicking on the graph legend item )
- valign sets the vertical alignment of the legend
- width sets the width of the legend block
- layout defines whether items should be placed vertically or horizontally
The full list of the legend parameters you can find in chapter 'Legend parameter: attributes'.
Setting different markers for different graphs
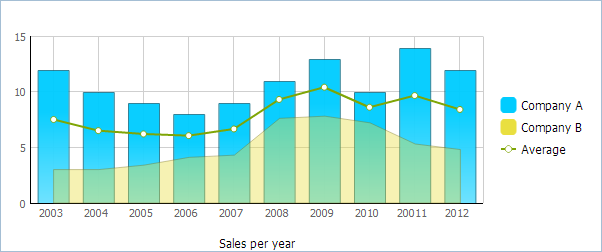
To set different markers for graphs you should:
- Specify legend items manually, through values parameter (don't use template);
- Use markerType property to assign the desired marker type to a graph.
legend:{
    layout:"y",
    align:"right",
    valign:"middle",
    width:100,
    values:[
        {text:"Company A",color:"#00ccff"},  // uses the default marker
        {text:"Company B",color:"#e9df40"},  // uses the default marker
        {text:"Average",color:"#b25151",
            markerType: "item"}              // uses the specified marker
    ]
}
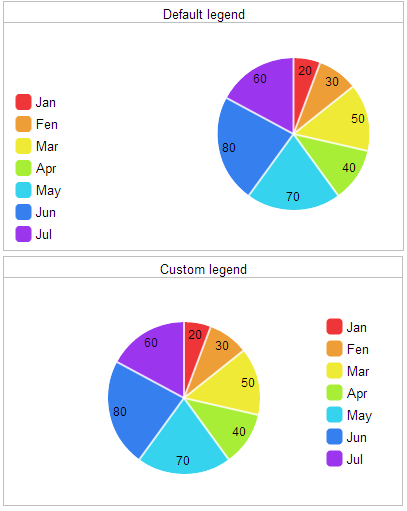
Automatic generation of legend items in the Pie chart
For the Pie chart you may use a predefined definition along with the usual legend definition (shown above) and create a legend in one line - by specifying a template for items labels (dhtmlxChart will do for all the rest for you on its own).
Let's compare:
//custom definition
var myChart =  new dhtmlXChart({
    view: "chart",
    type:"pie",
    ...
    legend:{
        width:75,
        align:"right",
        valign:"middle",
        template:"#month#"
    }
});
//default definition
var myChart =  new dhtmlXChart({
    view: "chart",
    type:"pie",
    ...
    legend:"#month#"
});