Multiple Graphs on a Chart
Generally, to add an additional graph to a chart you should use the addSeries method.
As a parameter, the method takes an object of the graph you'd like to add to the chart. The graph is specified in a standard way.
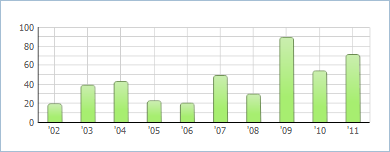
Single graph
var barChart =  new dhtmlXChart({
    view:"bar",
    container:"chartBox",
    value:"#sales#",
    color: "#58dccd",
    xAxis:{ template:"'#year#" }
});
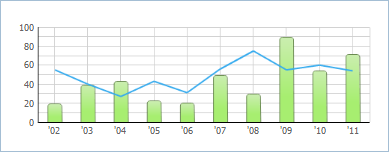
Multiple graphs
var barChart =  new dhtmlXChart({..});

barChart.addSeries({
     view: "line",
     item:{  radius:0 },
     line:{  color:"#36abee" },
     value:"#sales3#"
});
If you add to the chart a graph of the same type, you can omit the view attribute:
Single graph
var barChart =  new dhtmlXChart({
    view:"bar",
    container:"chartBox",
    value:"#sales#",
    xAxis:{ template:"'#year#" }
});
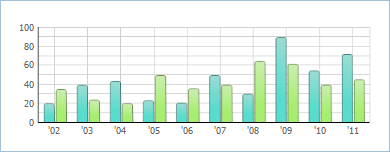
Multiple graphs
var barChart =  new dhtmlXChart({..});

barChart.addSeries({
    value:"#sales2#",
    color:"#a7ee70"
});
Related methods
- addSeries - adds the new data property representation
- hideSeries - hides a series with the specified index
- showSeries - shows a series with the specified index
- clearSeries - removes all series