Customizing Pivot
dhtmlxPivot provides you with a range of customization possibilities. You may color cells depending on their values, apply various styling for the headers of rows and columns and define custom date formats.
Conditional Formatting of Cells
There is a possibility to highlight cells with particular data values. It can be implemented with the help of the mark configuration property. This option allows coloring cells, depending on the specified condition set by a function.
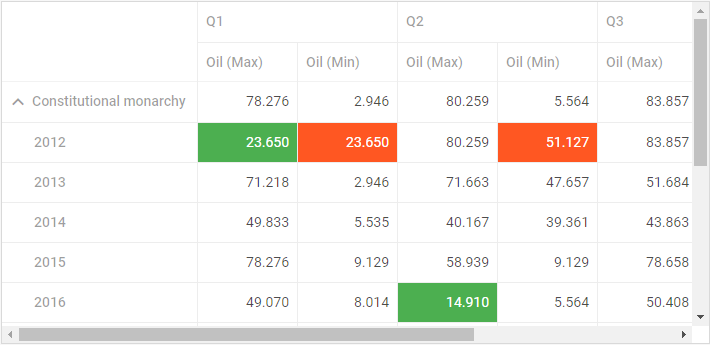
- styling cells with min and max values
There are two predefined functions that find the min and max values in a column. You can refer to them and apply desired styles to the cells that contain min and max values. For this you need to specify the mark property and set its value as an object with two attributes that correspond to the described functions.
For example:
<style>
    .max_cell {
        background: #FF5722;
        color: #FFF
    }

    .min_cell {
        background: #4CAF50;
        color: #FFF
    }
</style>

var pivot = new dhx.Pivot(document.body, {
    data: dataset,
    fields: {
        // the fields structure
    },
    fieldList: [
        // the list of fields
    ],
    // styling cells with min and max values
    // via the predefined functions
    mark: {
        min: "min_cell",
        max: "max_cell"
    }
});
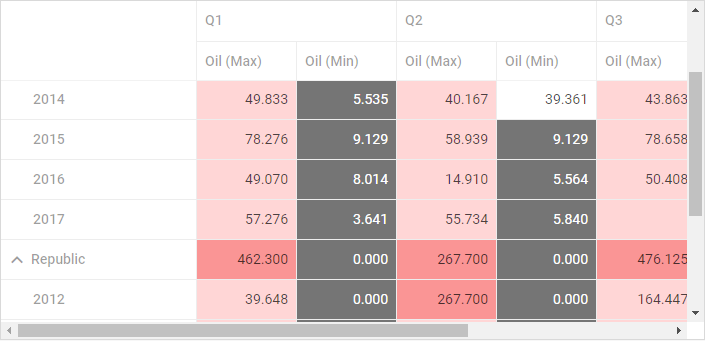
- styling cells via a custom function
You can also specify your own function that will define the logic of applying styles to cells with certain values. You need to use this function as a value of the mark property in the Pivot configuration object.
A custom function takes several parameters:
- cell - the value of a cell
- columnData - an array with the data of a column
- row - the object of a row
- column - the object of a column
and must return a string with the name of the applied CSS class.
<style>
    .mark {
        background: #757575;
        color: #FFF;
    }

    .customMaxCell {
        background: #ffd6d6;
    }

    .biggestMaxCell {
        background: #fa9595;
    }
</style>


var pivot = new dhx.Pivot(document.body, {
    data: dataset,
    fields: {
        // the fields structure
    },
    fieldList: [
        // the list of fields
    ],
    // styling cells with values less than 10
    // via a custom function
    mark: function (cell, columnData, row, column) {
        if (column.method === "max") {
            var max = Math.max.apply(null, columnData);
            if (max === parseFloat(cell)) {
                return "biggestMaxCell"
            }
            return "customMaxCell"
        }
        if (cell < 10 && cell !== null) {
            return "mark"
        }
        return false;
    }
});
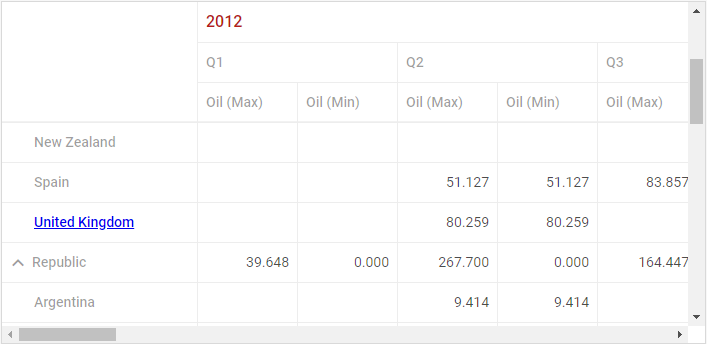
Setting Templates for Headers
You can change the appearance of column and row headers. For instance, if you want to style a column header and change its font, you can create a CSS class for that and use it in the template for the header. The template should be a function that returns the changed label.
.myCustomClass {
    color: #b71c1c;
    font-size: 16px;
}
new dhx.Pivot(document.body, {
    data: dataset,
    fields: {
        // pivot fields structure
    },
    fieldList: [
        { id: "name", label: "Name" },
        { id: "year", label: "Year", template: function (text, obj) {
             return '<span class="myCustomClass">' + text + '</span>'
          }
        },
        // more fields
    ],
    layout: {
        rowsHeadersWidth: "auto"
    }
});
Related sample: Headers template
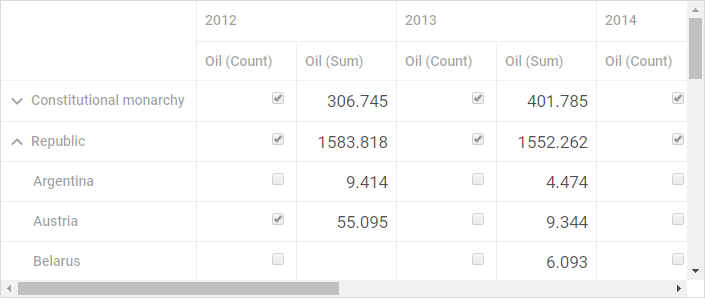
Setting Templates for Cells
dhtmlxPivot provides you with the possibility to show any custom content in the datatable cells. You need to specify the cellTemplate property in the field object and define a function that will implement the logic of rendering content of cells. The template function takes three parameters:
- text - the value of a cell
- row - the object of a row
- column - the object of a column
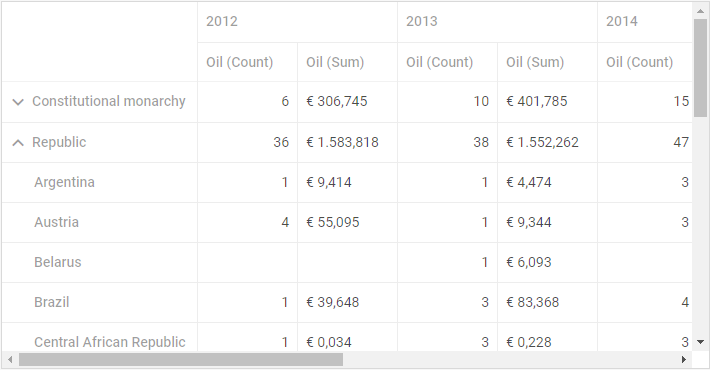
For instance, you can show different content depending on the operation set for a column. In the example below the content of cells is specified in the following way:
- if the column operation is "sum", the cells will display the result of the operation
- if the column operation is "count", the cells will display:
- an unchecked checkbox, if the cell value is more than 3
- a checked checkbox otherwise
var pivot = new dhx.Pivot(document.body, {
    data: dataset,
    fields: {
        rows: ["form", "name"],
        columns: ["year"],
        values: [{ id: "oil", method: "count" }, { id: "oil", method: "sum" }],
    },
    fieldList: [
        // previous fields
        {
          id: "oil",
          label: "Oil",
          cellTemplate: function (text, row, col) {                                              if (col.method === "sum") {                                                            return '<div class="customCell">' + (text||"") + '</div>'                       } else {                                                                                return '<input class="custom_div" type="checkbox" disabled ' +                          (text > 3 ? "checked" : "") + ' ></div>'                                    }
          }
        },
        { id: "balance", label: "Balance" },
        { id: "when", label: "When", type: "date", format: "%d/%m/%Y" }
    ]
});
Related sample: Cells template
Custom Date Grouping Types
You can add custom operations for grouping data by dates by using the addSubField method.
The method takes three parameters:
- name - (string) the name of the date field
- functor - (function) the function for grouping
- label - (string) the label for a new option
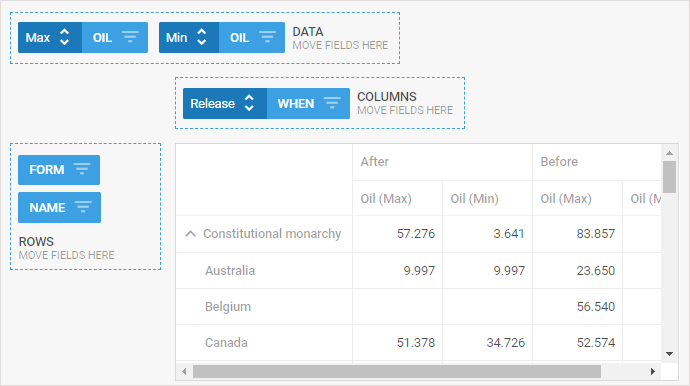
For instance, it can be useful if you want to group data into two columns relative to the release date:
var releaseDate = new Date(2017, 10, 10);
pivot.addSubField("when", function(val){
    return val > releaseDate ? "After" : "Before"
}, "Release");
pivot.setFields({
    rows: ["form", "name"],
    columns: [{ "id": "when", "group": "Release" }],
    values: [{ id: "oil", method: "max" }, { id: "oil", method: "min" }],
});
Custom Format for Cells
dhtmlxPivot provides the possibility to set custom format for values of cells. You can specify a custom format via the customFormat configuration property. It is a function that takes two parameters:
- cellValue - the value of the cell
- method - the type of operation that will be applied to data
Thus it is possible to define different custom formats for values in columns that are assigned to different operations:
var myPivot = new dhx.Pivot("container", {
    data: dataset,
    fields: {
        // initial pivot structure
    },
    fieldList: [
        // the full list of fields
    ],
    customFormat: function (cellValue, method) {
        if (method === "count") {
            return cellValue.toLocaleString("de");
        }
        return "€ " + cellValue.toLocaleString("de")
    }
});
In the above example custom format is set for columns according to the following scheme:
- for columns with the "count" operation, the rules of the German locale are applied
- for columns with the "sum" operation, the "euro" sign preceeding the cell value and the rules of the German locale are applied
Related sample: Custom formatting
Back to top