How to Start
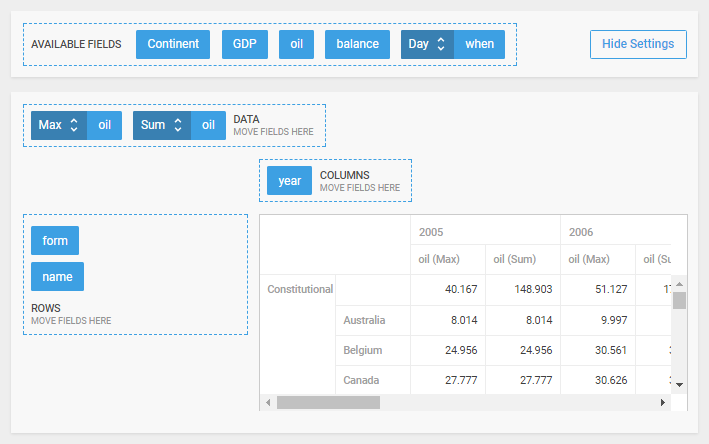
If you are in two minds about how to add dhtmlxPivot into your web application, you are in the right place. This tutorial will guide you through the main stages of Pivot creation and show you the possibilities of the component's configuration.
After completing all the steps below, you will get a fully functional Pivot, ready to analyze any complex data you provide for it.

Step 1. Including Source Files
To begin with, create an HTML file and call it myPivot.html. After that you need to include the source files of Pivot into your HTML file (to be able to use the functionality of the library). There are two necessary files:
- the JS file of dhtmlxPivot
- the CSS file of dhtmlxPivot
and - the link to the Google Fonts source file for the correct rendering of fonts
myPivot.html
<!DOCTYPE html>
<html>
<head>
  <title>How to Start with dhtmlxPivot</title>
  <script src="codebase/pivot.js"></script>

  <link href="codebase/pivot.css" rel="stylesheet">
  <link href="https://fonts.googleapis.com/css?family=Roboto:400,500" rel="stylesheet">
</head>
<body>
    <script>        // your code will be here    </script>
</body>
</html>
Step 2. Creating Pivot
Then you can initialize Pivot. For this, you should create a DIV container and place dhtmlxPivot into it. So, your steps are:
- specify a DIV container in the myPivot.html file
- initialize dhtmlxPivot using the
dhx.Pivotconstructor
As parameters, the constructor function takes the HTML container where Pivot will be placed and the Pivot configuration object.
myPivot.html
<!DOCTYPE html>
<html>
<head>
  <title>How to Start with dhtmlxPivot</title>
  <script src="codebase/pivot.js"></script>

  <link href="codebase/pivot.css" rel="stylesheet">
<link href="https://fonts.googleapis.com/css?family=Roboto:400,500" rel="stylesheet">
</head>
<body>
    <div id="container"></div>

    <script>        var myPivot = new dhx.Pivot("container", {
            fields: {
                // initial pivot structure
            },
            fieldList: [
                // the full list of fields
            ]
        });    </script>
</body>
</html>
Step 3. Setting Pivot Config
Now you need to define the Pivot configuration. There are two mandatory attributes you must set in the configuration object:
- fields - specifies the initial Pivot fields and structure, and sets the scheme for data analysis
- fieldList - defines the list of fields from the data set that will be available for use in Pivot
Other attributes are optional. See the full list of config properties.
myPivot.html
var myPivot = new dhx.Pivot("container", {
    data: dataset,
    fields: {
        rows: ["form", "name"],
        columns: ["year"],
        values: [{ id: "oil", method: "max" }, { id: "oil", method: "sum" }],
    },
    fieldList: [
        { id: "name", label: "name" },
        { id: "year", label: "year" },
        { id: "continent", label: "Continent" },
        // all fields
    ]
  }
);
Later you can change the Pivot configuration. Read about the possibilities of adjusting Pivot to your needs.
Step 4. Loading Data into Pivot
Finally, you should populate Pivot with data. dhtmlxPivot loads data in the JSON format. You can specify the data source as an inline object.
To load data into Pivot, use the data property and set the dataset as its value.
myPivot.html
var dataset = [
    { "name": "India",     "year": 2005,   "continent": "Asia",    "gdp": 808.744 },
    { "name": "Chad",      "year": 2011,   "continent": "Africa",  "gdp": 9.345 },
    { "name": "Belarus",   "year": 2011,   "continent": "Europe",  "gdp": 55.136 },
    // more fields
];


var myPivot = new dhx.Pivot("container", {
    data: dataset,                  fields: {
       // initial pivot structure
    },
    fieldList: [
        // the full list of fields
    ]
  }
);
You can find more info on loading data into Pivot in the article Loading Data into Pivot.
What's Next
Now Pivot is ready and only waits for your instructions. You can proceed to calculations and data exploring.
If you feel like diving deeper into the nature of dhtmlxPivot, these are suggestions for further studying:
Back to top