Configuring Pivot
Configuring Fields
Changing fields names
The names of the fields relate to the key names of the data properties. To change the default name of the field, you can specify the desired name with the help of the fieldList property of the Pivot configuration object.
var pivot = new dhx.Pivot(container, {
    data: dataset,
    fields: {
       // pivot fields structure
    },
    fieldList: [                                               { id: "name", label: "Name" },                  { id: "gdp", label: "GDP" },                    // more fields                              ]                                                                    }
);
Sorting fields
You can sort columns by a click on column headers. Besides, you can set the sorting direction for columns and rows. Make use of the sortDir property for each field in a fieldList:
new dhx.Pivot(document.body, {
    data: dataset,
    fields: {
        // pivot fields structure
    },
    fieldList: [
        { id: "name", label: "Name", sortDir: "desc" },
        { id: "year", label: "Year", sortDir: "asc" },
        // more fields
    ]
});
In this example, the names are sorted in the descending order, and data for years are sorted in the ascending order.
Related sample: Headers sort direction
Configuring Date Fields
In case your dataset contains dates, you should set a special type "date" for fields with dates and set common format for dates in the dataset.
fieldList: [
    { id: "name", label: "name" },
    { id: "when", label: "when", type: "date", format: "%d/%m/%Y" }
]
Grouping data by dates
Date fields allow you to group data by dates. You can choose the necessary type of grouping by clicking the toggle button in the date field.

There are several types of operations that allow grouping data by dates:
- Day - takes from the dataset all values of the date property that correspond to each day of the week and renders them in the datatable
- Week - takes from the dataset all values of the date property that correspond to each week and renders them in the datatable
- Month - takes from the dataset all values of the date property that correspond to each month of the year and renders them in the datatable
- Year - takes from the dataset all values of the date property that correspond to a particular year and renders them in the datatable
- Quarter - takes from the dataset all values of the date property that correspond to a quarter of a year and renders them in the datatable
Setting predefined date grouping type
If you want rows or columns of Pivot to be grouped by a certain date type, you need to set a date field in the corresponding row/column as an object with two properties:
- id - the id of the field
- group - the type of grouping
fields: {
    rows: ["form", "name"],
    columns: ["year", { "id": "when", "group": "dateByQuarter" }],
    fields: [{ id: "oil", method: "max" }, { id: "oil", method: "sum" }],
}
The types of grouping correlate with the types of operations with dates:
- dateByDay - groups data values by days of the week
- dateByWeek - groups data values by weeks
- dateByMonth - groups data values by months
- dateByQuarter - groups data values by year's quarters
- dateByYear - groups data values by years
It is also possible to define custom date grouping types.
Available formats of dates
While specifying the format for dates, you can use any character from the following list:
| %d | day as a number with leading zero, 01..31 |
| %j | day as a number, 1..31 |
| %D | short name of the day, Su Mo Tu... |
| %l | full name of the day, Sunday Monday Tuesday... |
| %m | month as a number with leading zero, 01..12 |
| %n | month as a number, 1..12 |
| %M | short name of the month, Jan Feb Mar... |
| %F | full name of the month, January February March... |
| %y | year as a number, 2 digits |
| %Y | year as a number, 4 digits |
| %h | hours 12-format with leading zero, 01..12) |
| %g | hours 12-format, 1..12) |
| %H | hours 24-format with leading zero, 01..24 |
| %G | hours 24-format, 1..24 |
| %i | minutes with leading zero, 01..59 |
| %s | seconds with leading zero, 01..59 |
| %a | am or pm |
| %A | AM or PM |
| %% | escape for % |
| %u | milliseconds |
| %P | timezone offset |
Configuring Operations
Using operations of particular types
By default, all four types of operations are available for columns. If you want to use just some of them, you need to specify the desired types in the operations array within the types object. (Set the types object as an attribute of the Pivot config object).
var pivot = new dhx.Pivot(document.body, {
    data: dataset,
    fields: {
        // fields structure
    },
    fieldList: [
        // full list of fields
    ],
    types: {
        operations: [
            { id: "sum", label: "sum" },
            { id: "min", label: "min" },
            { id: "max", label: "max" }
        ]
    }
});
Renaming types of operations
You can set a different name for an operation by changing its label:
types: {
    operations: [
        { id: "sum", label: "SUM" },
        { id: "min", label: "MIN" },
        { id: "max", label: "max" },
        { id: "count", label: "count"}
    ]
}
Note that besides the renamed operations, you should also define all needed operations, even if their names are not changed. Otherwise, they won't be displayed, since the new types object will replace the previous one.
Related sample: Available methods
Defining Pivot Look and Feel
There is a set of attributes you can use to get the necessary look and feel of Pivot layout. The layout configuration is adjusted with the help of the layout property of the Pivot configuration object (the second parameter of the constructor function).
var pivot = new dhx.Pivot(document.body, {
    data: dataset,
    fields: {
        rows: ["form", "name"],
        columns: ["year"],
        values: [{ id: "oil", method: "max" }, { id: "oil", method: "sum" }],
    },
    fieldList: [
        { id: "name", label: "name" },
        // the full list of fields
    ],
    layout: {                               leftMargin: 300,                    // other attributes             }                                 }
);
You can use the following attributes inside the layout object:
- leftMargin - (number) defines the space between the left side of the Pivot and the datatable
- gridOnly - (boolean) specifies that only the grid part is rendered (the "Hide/Show Settings" button remains on the screen).
false by default
Related sample: Grid only mode - readonly - (boolean) sets the read-only mode for Pivot. false by default. See details below
- rowsHeadersWidth - (number|string) sets the width of the rows headers, can be set either as a number of pixels or "auto"
- columnsWidth - (number|string) sets the width of the columns, can be set either as a number of pixels or "auto"
rowsWidth- (number) sets the width of the Pivot rows (deprecated, will be deleted in v2.0, use columnsWidth instead)- liveReload - (boolean) true by default. Enables automatic updates in Pivot on applying new settings.
If set to false, defines that changes in the Pivot settings will be applied only after clicking the Apply button.
Related sample: Manual apply - fieldsCloseBtn - (boolean) adds close buttons for all selected fields (in the Rows, Columns and Data sections)
Related sample: Manual apply - showFilters - (boolean) defines whether filters will be enabled on Pivot initialization, true by default
Related sample: - footer - (boolean) adds a footer row into the grid to show a total result of the operation set for a column. See details below.
Related sample: Grid with footer - gridMode - (string) the mode of displaying data in grid: "tree" (default) or "flat"
Related sample: Grid flat mode - repeatRowsHeaders - (boolean) defines whether the content of headers will be repeated in every row, false by default. This config is applied only when the grid is used in the "flat" mode
- fieldSelectorType - (string) defines the appearance of the fields selectors: "loop" or "dropdown" (default)
Related sample: Field selectors
You can get the current configuration settings defined for Pivot.
Making Pivot Read-only
If necessary, you can specify the read-only mode for Pivot. In this mode only the grid part of the Pivot will be rendered on the screen. Thus, it won't be possible to modify the predefined settings.
To make Pivot read-only, you need to set the readonly attribute of the layout object to true:
var pivot = new dhx.Pivot(document.body, {
    data: dataset,
    fields: {
        // fields structure
    },
    fieldList: [
        // full list of fields
    ],
    layout: {
        readonly: true                  }
  }
);
Total Operation per Column
You can specify a footer row for the grid of pivot to show a total result of the operation set for a column.
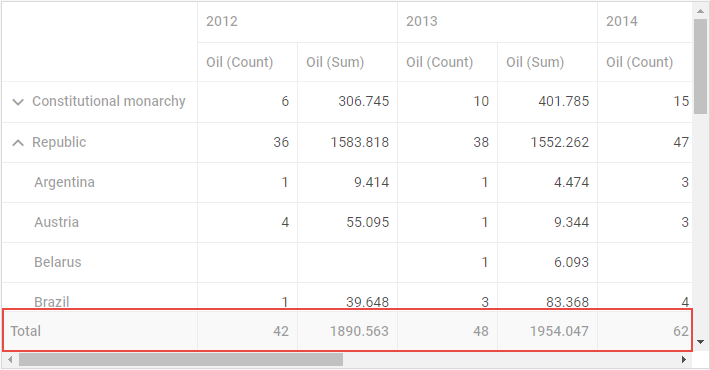
To add a footer, specify the footer:true option in the layout configuration:
var pivot = new dhx.Pivot(document.body, {
    data: dataset,
    fields: {
        // fields structure
    },
    fieldList: [
       // full list of fields
    ],
    layout:{
        footer:true                 }
});
Related sample: Grid with footer
Setting Columns Width
You can adjust the width of columns as well as of the headers of the rows via the related attributes of the layout configuration option:
rowsHeadersWidth - (number|string) sets the width of the rows headers. You can either set its value as a number of pixels to apply a fixed width to headers of rows or use "auto" to automatically adjust their width to the widest header.
columnsWidth - (number|string) sets the width of the columns. You can either set its value as a number of pixels to apply a fixed width or use "auto" to automatically adjust the width of a column to the widest cell.
Related sample: Set columns width
var pivot = new dhx.Pivot(document.body, {
    data: dataset,
    fields: {
        // fields structure
    },
    fieldList: [
        // full list of fields
    ],
    layout: {
        columnsWidth:"auto",                rowsHeadersWidth: "auto"        }
});
Related sample: Auto width. Sizing columns to content
Grid Mode
You can change the mode of displaying data in the grid with the help of the gridMode attribute of the layout object. The attribute can take two values:
- "tree" (default) - to present the grid data as a tree-like structure
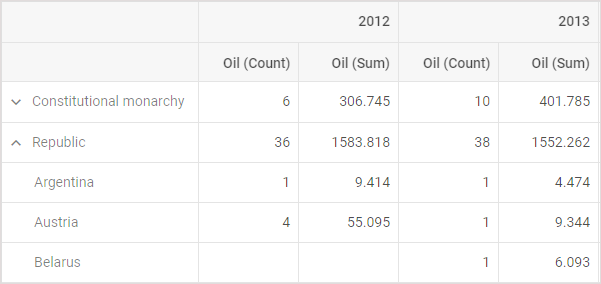
- "flat" - to display the grid data as a flat structure
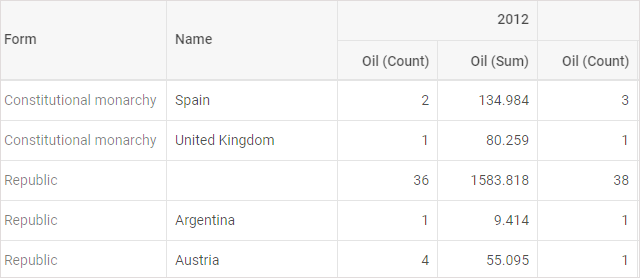
In the flat mode you can disable repeating of the headers content in every row by setting the repeatRowsHeaders property to false in the configuration of the layout object.
var pivot = new dhx.Pivot(document.body, {
    data: dataset,
    fields: {
        rows: ["form", "name"],
        columns: ["year"],
        values: [{ id: "oil", method: "max" }, { id: "oil", method: "sum" }],
    },
    fieldList: [
        { id: "name", label: "name" },
        // the full list of fields
    ],
    layout: {                                   gridMode:"flat",                       repeatRowsHeaders:false      }                                 }
);
Related sample: Grid flat mode
Types of fields selectors
By default, selectors of fields look like dropdown lists.
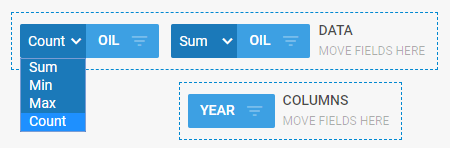
The fieldSelectorType attribute of the layout object provides the possibility to change their appearance. While by default this configuration property takes the "dropdown" value, there is also the "loop" value that you can use as an alternative:
var pivot = new dhx.Pivot(document.body, {
    data: dataset,
    fields: {
        // fields structure
    },
    fieldList: [
        // full list of fields
    ],
    layout: {
    fieldSelectorType:"loop"        }
  }
);
This is how the "loop" type of fields' selectors look like:
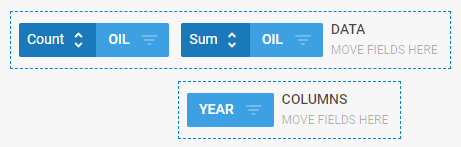
Related sample: Field selectors
Back to top