DHTMLX Pivot overview
JavaScript Pivot library is a ready-made component for creating Pivot tables from large datasets. The widget API can be easily adjusted to the needs of your web application. It provides the end user with functionality for comparing and analyzing complex data within one table.
Pivot structure
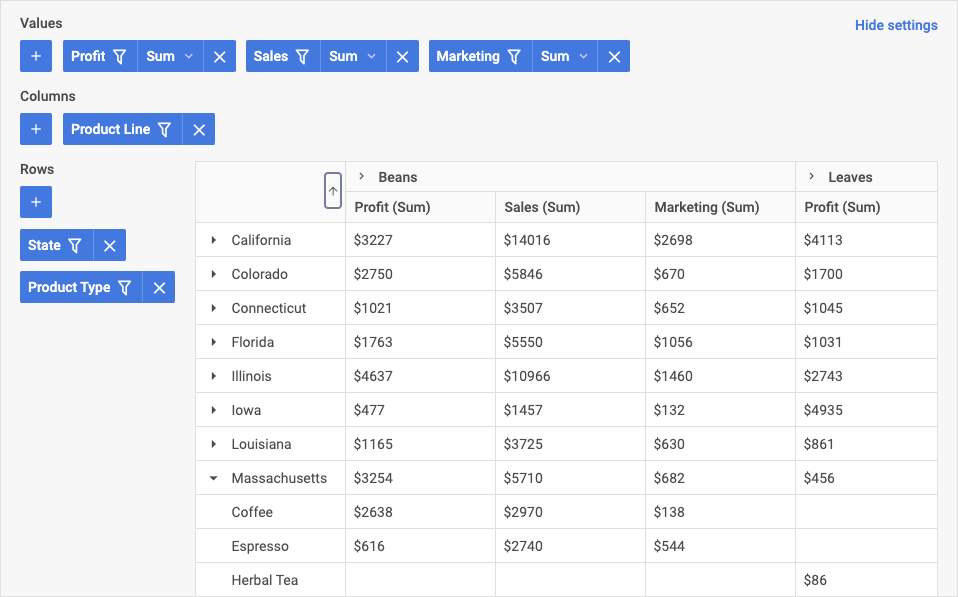
The Pivot UI consists of the two main components: the Configuration panel and the table with data.
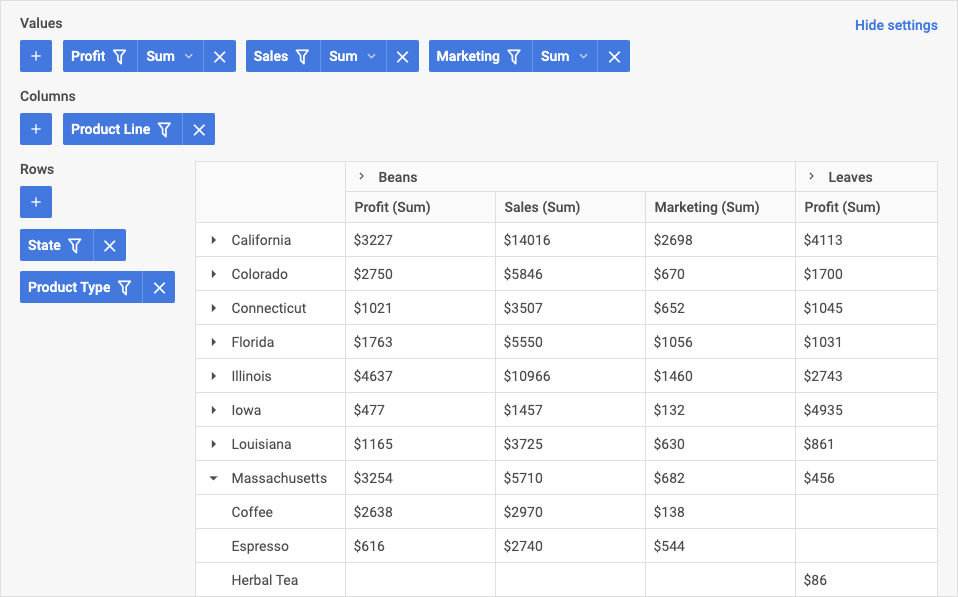
Configuration panel
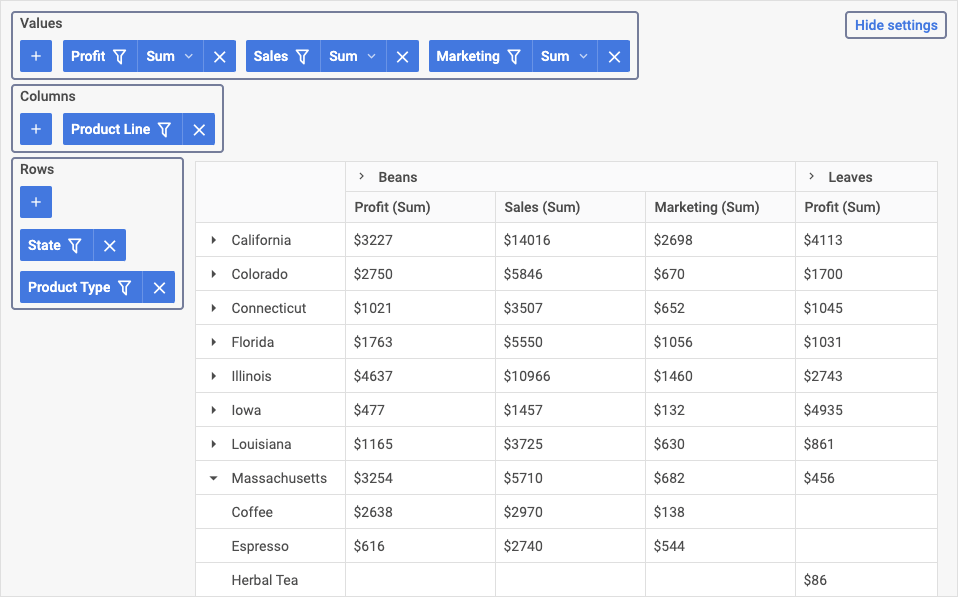
The Configuration panel allows adding columns and rows to the table as well as values' fields that define data aggregation methods. You can add each item via the next areas in the panel:
- Values: you can add values that define how data is aggregated (such as sum, min, max values)
- Columns: you can configure columns of the table (define which fields will be applied as columns)
- Rows: you can configure which fields should be applied as rows of the table
To hide the Configuration panel, click the Hide Settings button:
Values area
In the Values area you can define which aggregation methods (such as min, max, count) will be applied to the cells of the Pivot table. You can perform the next operations:
- add and remove fields to/from the values area
- change the order and priority of values in the table
- filter data
- set operations that will be applied to the fields of the table
For more details, please refer to the Operations in areas and Filters sections.
Columns area
In the Columns area, you can perform the following operations:
- add and remove columns (i.e., add/remove fields applied as columns)
- change the order and priority of columns in the table
- filter data
For more details, please refer to the Operations in areas and Filters sections.
Rows area
In the Configuration panel for the Rows area, you can perform the following operations:
- add and remove rows (i.e., add/remove fields applied as rows)
- change the order and priority of rows in the table
- filter data
For more details, please refer to the Operations in areas and Filters sections.
Operations in areas
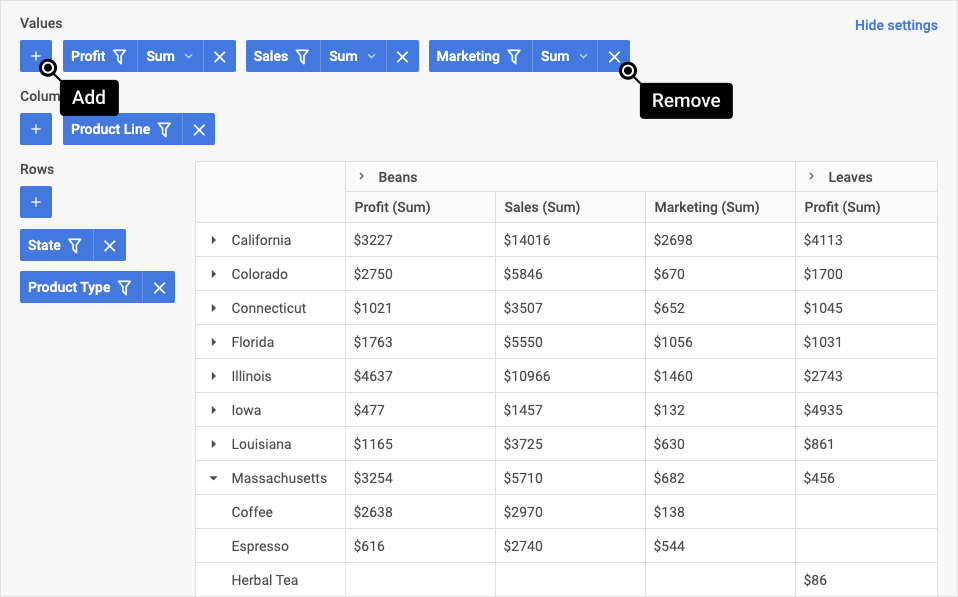
In all three areas of the Configuration panel you can add and remove fields to/from the table. If you want some field to be applied as a row or column, select it in the appropriate area (columns or rows).
To add a new field, in the required area, click the "+" button and select the name from the drop-down list.
To remove an item, click the delete button ("x").
To change the order of values/rows/columns in the table, drag an item to the desired position. The closer an item is to the left in the area's toolbar list, the higher its priority and position in the table.
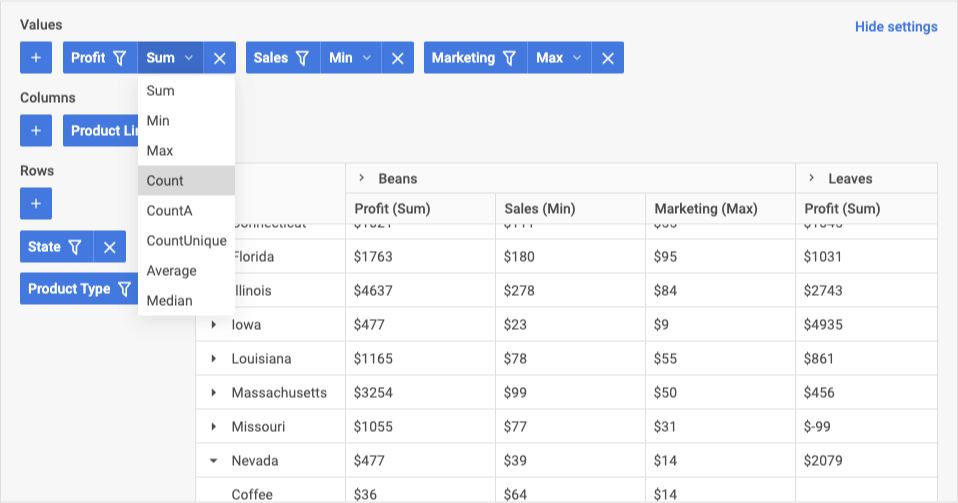
To set operations that will be applied to all data of the column of the table, in the Values area, click the value operation for the required field in the drop-down list, and select the required option from the list.
Filters
Filters appear as drop-down lists for each field in all areas. The Pivot provides the next condition types for filtering:
- for text values: equal, notEqual, contains, notContains, beginsWith, notBeginsWith, endsWith, notEndsWith
- for numeric values: greater: less, greaterOrEqual, lessOrEqual, equal, notEqual, contains, notContains, begins with, not begins with, ends with, not ends with
- for date types: greater, less, greaterOrEqual, lessOrEqual, equal, notEqual, between, notBetween
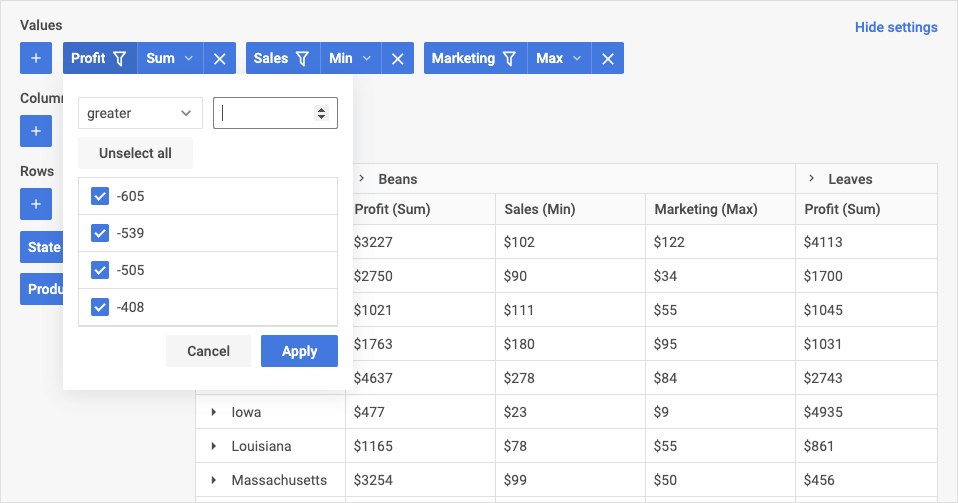
To filter data in the table, click the filter sign of one of the items in the required area, and then select the operator and set the value to filter by, and then click Apply. The fields to which filtering is applied will be marked with a special filter sign.
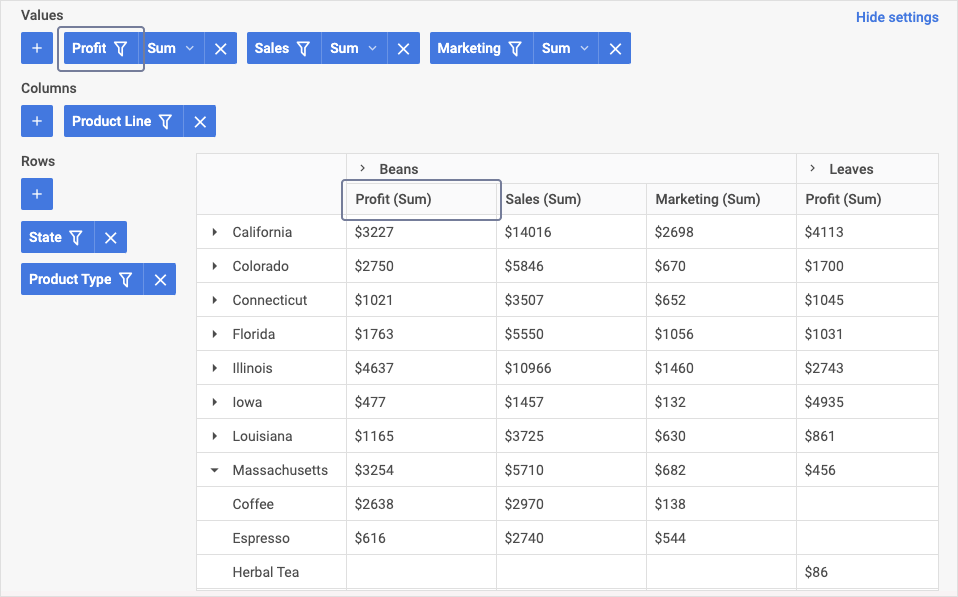
Table
Data in the table is displayed as configured in the Configuration panel. The sorting in columns is enabled by clicking the column header:
What's next
Now you can get down to incorporating Pivot into your application. Follow the directions of the How to start tutorial for guidance.
If you apply the functionality provided by the widget API you can get a good-looking Pivot table with more features as the one in the sample below: