Setting up Scale
The configuration of scales is specified via the scales property. You can specify any number of scales by setting scale objects in the array of the scales config:
// a single day-scale
gantt.config.scales = [
    { unit: "day", step: 1, format: "%j, %D" }
];

// several scales at once
gantt.config.scales = [
    { unit: "month", step: 1, format: "%F, %Y" },
    { unit: "week", step: 1, format: weekScaleTemplate },
    { unit: "day", step: 1, format: "%D", css: daysStyle }
];
It is possible to configure the following aspects of the time scale (X-Axis):
You can also add a custom scale.
Time units
To set the unit of the scale, use the unit property in the corresponding scale object:
Possible values are: "minute", "hour", "day" (by default), "week", "quarter", "month", "year".
gantt.config.scales = [
    { unit: "month", step: 1, format: "%F, %Y" },
    { unit: "day", step: 1, format: "%j, %D" }
];

gantt.init("gantt_here");
Range
Default range settings
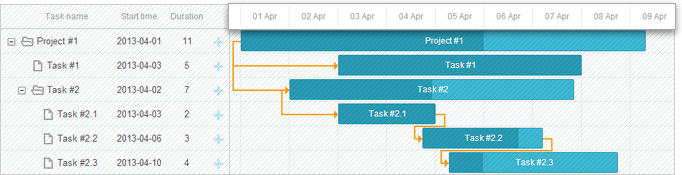
If you don't specify the date range explicitly, Gantt uses the dates of the loaded tasks and adds offsets before the first and after the last task in the scale. The offset is defined by the settings of the time scale. Depending on the scale_offset_minimal value, it will be either the time unit defined in via the unit attribute of the scales option or by the smallest of the time scale units.
You can get the displayed date range programmatically using the getState method.
const state = gantt.getState();

console.log(state.min_date);
// -> Mon Jan 01 2025 00:00:00

console.log(state.max_date);
// -> Tue Jan 01 2026 00:00:00
The scale range is recalculated on gantt rendering. If the user moves a task outside the displayed time range, the task row will be displayed, but the bar element won't be visible until complete repainting is done.
In order to adjust scale automatically, use the fit_tasks config.
gantt.config.fit_tasks = true;
gantt.init("gantt_here");
Related sample: Auto resize scale
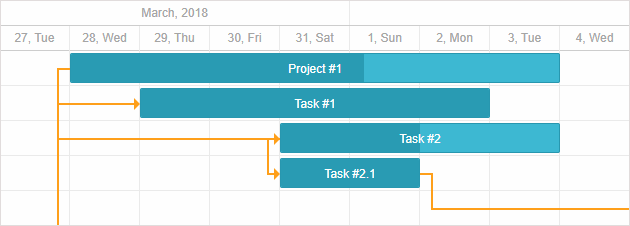
Setting date range explicitly
Alternatively, you can set the date range explicitly by using the start_date and end_date configuration options:
gantt.config.start_date = new Date(2025, 02, 31);
gantt.config.end_date = new Date(2025, 03, 09);

gantt.init("gantt_here");
They can also be specified in the gantt initialization call:
gantt.init("gantt_here", new Date(2025, 02, 31), new Date(2025, 03, 09));
Related sample: Define displayed date range
The tasks that don't fit into the specified interval won't be displayed in the Gantt chart, unless they are marked as unscheduled.
Related sample: Show Unscheduled Tasks
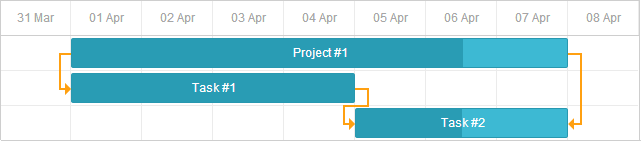
Note
If both the start_date and end_date options are specified and you create a task that is outside the range, the task will disappear from the chart. To display the task in the chart use the show_tasks_outside_timescale config.
gantt.config.start_date = new Date(2025, 02, 31);
gantt.config.end_date = new Date(2025, 03, 09);
gantt.config.show_tasks_outside_timescale = true;

gantt.init("gantt_here");
In case you don't use this config you can extend the range:
gantt.attachEvent("onLightboxSave", (id, task, is_new) => {
    const { start_date: taskStart, end_date: taskEnd } = task;
    const { start_date: scaleStart, end_date: scaleEnd } = gantt.config;

    // if the task is out of the current timescale range
    if (scaleStart > taskEnd || scaleEnd < taskStart) {
        // update the timescale range
        gantt.config.end_date = new Date(
            Math.max(taskEnd.valueOf(), scaleEnd.valueOf())
        );

        gantt.config.start_date = new Date(
            Math.min(taskStart.valueOf(), scaleStart.valueOf())
        );

        gantt.render();
    }

    return true;
});
Or add validation to the lightbox control:
gantt.attachEvent("onLightboxSave", (id, task, is_new) => {
    const { start_date: taskStart, end_date: taskEnd } = task;
    const { start_date: scaleStart, end_date: scaleEnd } = gantt.config;

    // Check if the task is out of the range
    if (scaleStart > taskEnd || scaleEnd < taskStart) {
        gantt.message({
            type: "warning",
            text: "Warning! The task is outside the date range!",
            expire: 5000
        });

        return false;
    }

    return true;
});
Changing the displayed range dynamically
There are several ways of how you can change the displayed range on the fly:
- you can control the time range with the help of the start_date / end_date configs, but dynamically adjust them to display loaded tasks.
You can do it by recalculating the scale range via updating the start_date / end_date configs each time gantt is repainted:
gantt.attachEvent("onBeforeGanttRender", () => {
    const range = gantt.getSubtaskDates();
    const scaleUnit = gantt.getState().scale_unit;

    if (range.start_date && range.end_date) {
        gantt.config.start_date = gantt.calculateEndDate(
            range.start_date, -4, scaleUnit
        );

        gantt.config.end_date = gantt.calculateEndDate(
            range.end_date, 5, scaleUnit
        );
    }
});

gantt.init("gantt_here");
- to 'force' the scale re-render each time a task doesn't fit into the existing scale interval, set the fit_tasks property to true:
gantt.config.fit_tasks = true;
gantt.init("gantt_here");
In case both the start_date and end_date options are specified, you need to make use of one of the options described above for the fit_tasks property to work correctly.
- it is also possible to automatically change the scale while dragging a task by specifying the necessary logic inside the handler of the onTaskDrag event:
gantt.attachEvent("onTaskDrag", (id, mode, task, original) => {
    const state = gantt.getState();
    const minDate = state.min_date;
    const maxDate = state.max_date;

    const scaleStep = gantt.date.add(
        new Date(), state.scale_step, state.scale_unit
    ) - new Date();

    let showDate;
    let repaint = false;

    if (mode == "resize" || mode == "move") {
        if (Math.abs(task.start_date - minDate) < scaleStep) {
            showDate = task.start_date;
            repaint = true;
        } else if (Math.abs(task.end_date - maxDate) < scaleStep) {
            showDate = task.end_date;
            repaint = true;
        }

        if (repaint) {
            gantt.render();
            gantt.showDate(showDate);
        }
    }
});
Related sample: Re-rendering Scale during Task Dragging
Displaying tasks outside the explicit date range
It is possible to show tasks that don't fit into the specified date range in the Gantt chart.
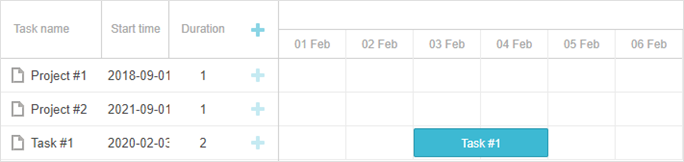
To do this you need to set the show_tasks_outside_timescale config parameter to true:
const data = {
    tasks: [
        { id: 1, text: "Project #1", start_date: "01-09-2024", end_date: "02-09-2024" },
        { id: 2, text: "Project #2", start_date: "01-09-2026", end_date: "02-09-2026" },
        { id: 3, text: "Task #1", start_date: "03-02-2025", end_date: "05-02-2025" }
    ],
    links: []
};

gantt.config.show_tasks_outside_timescale = true;

gantt.init("gantt_here", new Date(2025, 1, 1), new Date(2025, 1, 7));
Related sample: Tasks outside timescale
As a result the tasks with the id "1" and "2" will be displayed on the page as empty rows in the timeline area and with the specified names and start dates in the grid.
Time step
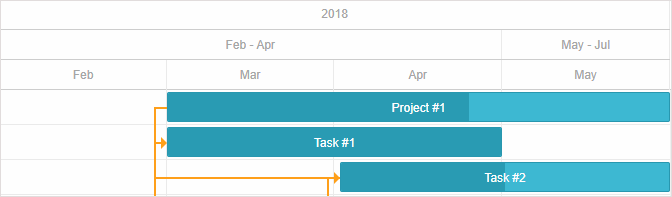
To set the step of the time scale, use the step property in the corresponding scale object:
const monthScaleTemplate = (date) => {
    const dateToStr = gantt.date.date_to_str("%M");
    const endDate = gantt.date.add(date, 2, "month");

    return `${dateToStr(date)} - ${dateToStr(endDate)}`;
};

gantt.config.scales = [
    { unit: "year", step: 1, format: "%Y" },
    { unit: "month", step: 3, format: monthScaleTemplate },
    { unit: "month", step: 1, format: "%M" }
];

gantt.init("gantt_here");
Related sample: Step config for the Quarter scale
Height
To set the height of the scale, use the scale_height property:
gantt.config.scale_height = 54;
gantt.init("gantt_here");
If you have several scales, they will share the specified height equally. For example, if scale_height is 60 pixels and you have 3 scales, each scale will have the height of 60 / 3 = 20 pixels.
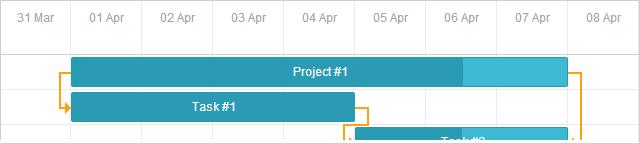
Date format
See the Date Format Specification article to know about available format characters
To set the format of the scale, use the format property in the corresponding scale object. The format of date can be set as a string:
gantt.config.scales = [
    { unit: "month", step: 1, format: "%F, %Y" },
    { unit: "week", step: 1, format: weekScaleTemplate },
    { unit: "day", step: 1, format: "%D", css: daysStyle }
];

gantt.init("gantt_here");
Related sample: Multiple scales
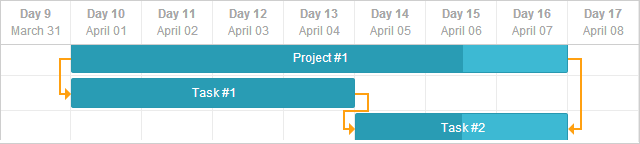
Or as a function that takes a date object as a parameter:
gantt.config.scales = [
    { unit: "day", step: 1, format: (date) => {
        return `<strong>Day ${dayNumber(date)}</strong><br/>${dateFormat(date)}`;
    }}
];
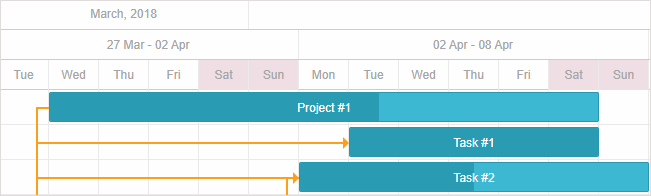
Styling
To style the cells of the time scale, use the css attribute in the corresponding scale object.
function getWeekOfMonthNumber(date) {
    let adjustedDate = date.getDate() + date.getDay();
    let prefixes = ['0', '1', '2', '3', '4', '5'];
    return (parseInt(prefixes[0 | adjustedDate / 7]) + 1);
}

gantt.config.scales = [
    { unit: "month", step: 1, format: "%F, %Y" },
    { unit: "week", step: 1, format: (date) => {
        return "Week #" + getWeekOfMonthNumber(date);
    }},
    { unit: "day", step: 1, format: "%j %D", css: (date) => {
        if (!gantt.isWorkTime(date)) {
            return "week-end";
        }
    }}
];
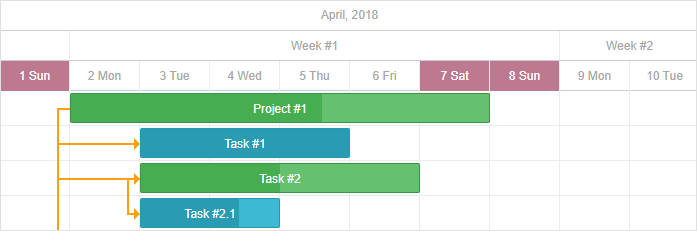
Related sample: Styling of cells of the time scale
In case the css property is not specified in the config of the scales, you can define the scale_cell_class template to apply the CSS class to the first time scale of the array of the scales config.
gantt.config.scales = [
    { unit: "day", step: 1, format: "%d" },
    { unit: "day", step: 1, format: "%D" },
    { unit: "hour", step: 1, format: "%H" }
];

gantt.templates.scale_cell_class = date => gantt.isWorkTime(date) ? "" : "week_end";
Related sample: Styling of the first time scale
To apply the scale_cell_class template to all scales of the time scale, set the inherit_scale_class property to true.
gantt.config.inherit_scale_class = true;Related sample: Styling of all scales
Note that while using work time calculations, you can use isWorkTime instead of hardcoded values:
gantt.config.work_time = true;
gantt.templates.scale_cell_class = date => gantt.isWorkTime(date) ? "" : "week_end";
Read more on applying a custom style to the timeline area in the Highlighting Time Slots article.
Custom time units
dhtmlxGantt allows you to define custom time units and set a template for labels in the scale configuration.
To define a custom unit you need to define 2 functions in the Date object:
Date gantt.date.<unit>_start(Date date);
Date gantt.date.add_<unit>(Date date, Integer increment);
- The first function shall return the start time unit for any given date (e.g. month_start for 14 Feb -> 1st Feb).
- The second function increments the date by any given number of duration units (e.g. 'date minus 2 days')
Usually, increment has a positive value because cells of the scale are created from left to right. But creation of the first cell is implemented from right to left, thus Gantt uses the negative value of the increment.
Example 1
Let's create a "fiscal_year" unit and assume that a fiscal year will end on the 31st of January. This is how the new unit can be specified:
const firstMonth = 1;
const firstDay = 1;

gantt.date.fiscal_year_start = date => {
    let next = new Date(date);

    if (next.getMonth() < firstMonth ||
        (next.getMonth() === firstMonth && next.getDate() < firstDay)) {
        next = gantt.date.add(next, -1, "year");
    }

    next = gantt.date.year_start(next);
    next.setMonth(firstMonth);
    next.setDate(firstDay);

    return next;
};

gantt.date.add_fiscal_year = (date, inc) => gantt.date.add(date, inc, "year");
And then use it in the code as in:
const dateToStr = gantt.date.date_to_str("%Y");

const fiscalYearLabel = date => dateToStr(gantt.date.fiscal_year_start(date));

gantt.config.scales = [
    { unit: "year", step: 1, format: "Calendar year %Y" },
    { unit: "fiscal_year", step: 1, format: fiscalYearLabel },
    { unit: "month", step: 1, format: "%M %Y" },
    { unit: "day", step: 1, format: "%d %M" }
];
Example 2
You may divide each "day" cell into three "hour" cells with labels 00, 08, 16. The logic will look like:
gantt.date.hour_custom_start = date => date;

gantt.date.add_hour_custom = (date, inc) => { // inc depends on the "step"
    const nextDate = new Date(date);

    if (nextDate.getHours() % 8 !== 0) { // the hour value is not 0, 8, or 16         const diff = Math.abs(8 - nextDate.getHours());         return gantt.date.add(nextDate, diff * inc, "hour");     }
    return gantt.date.add(date, 8 * inc, "hour"); };

gantt.config.scales = [
    { unit: "day", step: 1, date: "%d %F" },
    { unit: "hour_custom", step: 1, date: "%H" }
];

gantt.config.date_grid = "%Y-%m-%d %H:%i";
Related sample: Custom hours on the scale
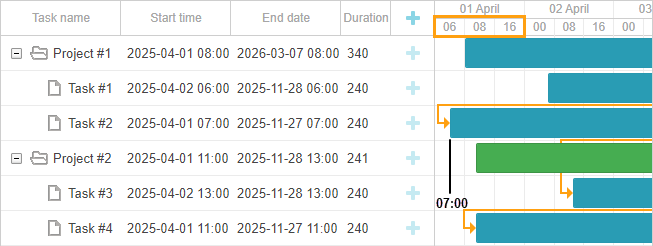
Let's consider how Gantt creates the first "hour" cell. As you can see from the example, the earliest task starts at 07:00. But 7 is not a multiple of eight, thus Gantt follows the rule:
if (nextDate.getHours() % 8 != 0) {
    const diff = Math.abs(8 - nextDate.getHours());  // 8 - 7 = 1
    return gantt.date.add(nextDate, diff * inc, "hour"); // 7 - 1 = 6
}
- Gantt calculates the time interval between 8:00 and 7:00:
diff = 08:00 - 07:00 = 1 hour - Then, Gantt finds the product of the time interval and increment:
diff * inc = 1 hour * (-1) = -1 hour
As a value of the inc parameter, Gantt uses the negative value of the time step (-1). - Finally, Gantt adds the received value to the time of the earliest task:
07:00 + (- 1 hour) = 06:00
The value of the first cell is 06.
To create the second "hour" cell, Gantt follows the same logic but uses the positive increment
- diff = 08:00 - 06:00 = 2 hours
- diff * inc = 2 hour * 1 = 2 hours
- 06:00 + 2 hours = 08:00
The value of the second cell is 08
At this stage, we can see that 8 is a multiple of eight, therefore the value of the next cell is calculated as 08:00 + 8 hours = 16:00, and so on for the other cells.
This logic works because we don't specify the date range explicitly.
For more samples, check the How to add a custom scale article.
Custom time spans
In this part you will find examples of how to customize and configure the time scale so that it shows or hides non-working time spans. Besides, you'll find an example of how to hide cells with non-working hours from the start of the scale even if the skip_off_time mode is enabled.
Below we give you an example of the custom scale for the most common case when working hours are from 08:00 to 12:00 and from 13:00 to 17:00.
gantt.plugins({
    auto_scheduling: true,
});

gantt.config.work_time = true;
gantt.config.correct_work_time = true;
gantt.config.duration_unit = "minute";
gantt.config.duration_step = 1;
gantt.config.time_step = 1;
gantt.config.round_dnd_dates = false;

gantt.setWorkTime({ hours: ["8:00-12:00", "13:00-17:00"] });
gantt.date.day_custom_start = date => date;
gantt.date.add_day_custom = (date, inc) => {     const nextDate = new Date(date);
    if (nextDate.getHours() < 8) {  // Statement 1        const diff = 8 - nextDate.getHours();         return gantt.date.add(nextDate, diff * inc, "hour");     }
    if (nextDate.getHours() === 8) {  // Statement 2        return gantt.date.add(nextDate, 9 * inc, "hour");     }
    if (nextDate.getHours() === 17) {  // Statement 3        return gantt.date.add(nextDate, 15 * inc, "hour");     }
    return gantt.date.add(date, 8 * inc, "hour"); };
gantt.config.scales = [
    { unit: "day_custom", step: 1, date: "%d %H:00" },
];
Related sample: Custom time spans
Let's imagine that the earliest task will start at 08:00 of April 1st, 2025 and consider how Gantt will add offsets before this task depending on the value of gantt.config.skip_off_time.
We will start with configuration which hides non-working hours from the time scale:
gantt.config.skip_off_time = true;
In this case, to create the first "hour" cell, Gantt will decrement hours of the earliest task until the time reaches working hours of the previous day.
- At first, Gantt will subtract 9 hours from 08:00 of April 1st, 2025 (Statement 2):
08:00 - 9 hours = 23:00 - Since 23:00 is non-working time which doesn't meet any of the conditions, Gantt will decrement the time again by subtracting 8 hours:
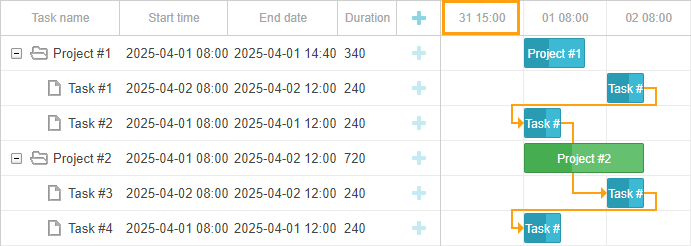
23:00 - 8 hours = 15:00 - The resulting time - 15:00 of March 31, 2025 - is considered as working time.
Therefore, 31 15:00 is the value which will be displayed on the first cell.
To understand how Gantt calculates all the other cells, let's disable gantt.config.skip_off_time:
gantt.config.skip_off_time = false;
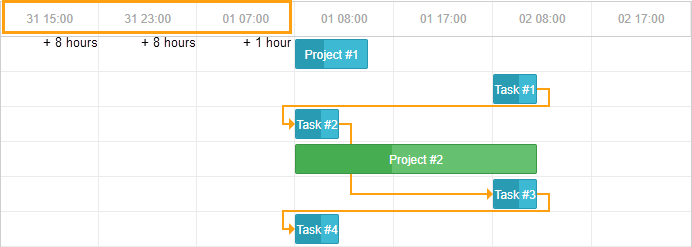
As we've found out above, the first cell of the time scale will have the 31 15:00 value. But now the amount of the empty cells before the earliest task will increase because cells with non-working hours will be displayed on the scale too.
To calculate the values of these cells, the following logic is applied:
- 15:00 of March 31, 2025 is working time which doesn't meet any of the specified conditions. Thus, to calculate the value of the second cell Gantt will increment the time by adding 8 hours:
15:00 + 8 hours = 23:00 - 23:00 of March 31, 2025 is non-working time which doesn't meet any of the conditions too. Thus, the value of the third cell will be calculated in the same way:
23:00 + 8 hours = 7:00 - 7:00 of April 1st, 2025 is non-working time which is less than 8:00 (Statement 3). The value of the next cell will be calculated as in:
- diff = 08:00 - 07:00 = 1 hour
- diff * inc = 1 hour * 1 = 1 hour
- 07:00 + 1 hour = 08:00
08:00 0f April 1st, 2025 is the date of our earliest task.
All other cells are created in the similar way.
As you can see, if you disable the skip_off_time property, Gantt can add more than one empty cell before the task with the minimal date. If you want the Gantt to create only one cell regardless of whether the property is enabled or not, you can apply the following logic:
gantt.date.add_day_custom = (date, inc) => {
    // When the work_time is enabled and the tasks are loaded,
    // calculate the date for the first cell.
    // Go from right to left starting from the minimal date,
    // get the closest date within the working hours
    // and subtract 1 hour from this date
    if (inc < 0 && gantt.getTaskByTime().length) {
        return gantt.calculateEndDate({
            start_date: date, duration: -1, unit: gantt.config._duration_unit
        });
    }

    // the beginning of the working hours (workday);
    // calculate when the workday ends
    if (date.getHours() === 8) {
        return gantt.calculateEndDate(date, 8);
    }

    // the end of the working hours (workday);
    // calculate when the next working day begins
    if (date.getHours() === 17) {
        return gantt.date.add(date, 15 * inc, "hour");
    }

    // if tasks are loaded, calculate the working dates for the second cell of scale
    // if tasks are absent, calculate the dates for all scale cells
    date = gantt.date.add(date, 1 * inc, "day");
    gantt.date.day_start(date);
    date = gantt.getClosestWorkTime({ date, dir: "future" });

    return date;
};

gantt.config.scales = [
    { unit: "day_custom", step: 1, date: "%d %H:%i" },
];

gantt.config.work_time = true;
gantt.config.skip_off_time = false;
Related sample: Equal offset for custom scales
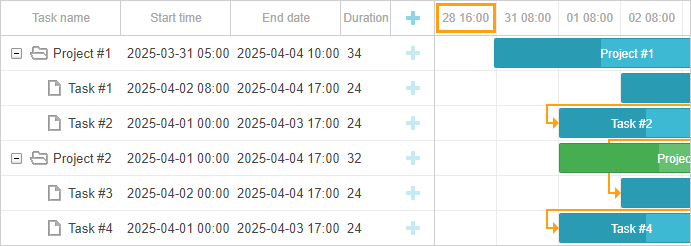
This is how the scale looks in the mode when non-working hours are hidden:
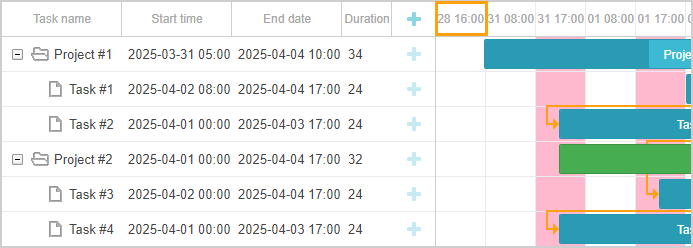
And here is how it looks when they are shown (gantt.config.skip_off_time is disabled):
Infinite scroll
You can find detailed examples on how to implement an infinite scroll in the timeline in the related article.
Sticky labels
Starting from v9.0, time scale labels are sticky by default. It means that when the width of a cell is significantly larger than the width of its label, the label will remain visible as you scroll through the timeline, staying attached to the viewport until it naturally scrolls off. This improves the visibility of scale labels, particularly when zoomed in or out.
To revert to the old behavior where labels are centered within their cells and do not remain visible while scrolling, you can disable sticky labels by setting the sticky property of the scale object to false:
gantt.config.scales = [
    { unit: "year", step: 1, format: "%Y", sticky: false },
    { unit: "month", step: 1, format: "%F", sticky: false },
    { unit: "day", step: 1, format: "%j", sticky: false }
];

gantt.init("gantt_here");
You can also force sticky labels for a particular scale regardless of the cell width by setting sticky: true. It will ensure the labels are always sticky, even when the label width is smaller than the cell width:
gantt.config.scales = [
    { unit: "year", step: 1, format: "%Y", sticky: true },
    { unit: "month", step: 1, format: "%F", sticky: true },
    { unit: "day", step: 1, format: "%j", sticky: true }
];

gantt.init("gantt_here");