Available only in PRO Edition
Extra Elements in Timeline Area
This functionality is available only in the PRO edition
Common description
By default, dhtmlxGantt renders elements of the timeline area as layers and does it in the following order:
- Timeline's grid
- Links
- Tasks
Displaying additional elements, such as a baseline or deadline marker, is usually done by creating a displayable layer and placing custom elements there (using the absolute positioning to put custom elements next to the related task).
To add one more layer to the timeline area, use the addTaskLayer method. As a parameter, the method takes a function that:
- Takes a task object;
- Returns either a DOM element that will be displayed, or false (the element for a task should be hidden).
gantt.addTaskLayer(function myNewElement(task) {
    var el = document.createElement('div');
    // your code
    return el;
});
Related sample: Displaying deadlines
Note:
- After you call the method, dhtmlxGantt adds a container to the timeline area.
- When dhtmlxGantt renders data, the addTaskLayer method will be called for each task and the returned DOM element will be appended to the container.
- For placing elements, you can use a usual absolute position.
- When a Gantt's task is updated, it will be updated in all layers including the custom ones (the function will be called for the updated task and the related DOM element will be replaced).
- dhtmlxGantt provides a method for calculating task's position and size - getTaskPosition. You can use it to calculate the position and size for your custom elements as well.
To learn how to increase the perfomance speed of rendering custom elements, read the addTaskLayer article.
If you need to show the custom content in all cells of the timeline, place HTML directly in the cells using the timeline_cell_content template. This way is easier to implement and faster in performance.
Example of usage
To understand how to apply this functionality, let's consider an example: you have a planned and an actual time for tasks and need to display both of times.
Step 1. Reduce the task height and move task lines upper
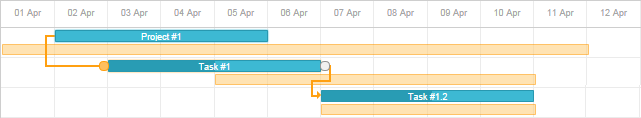
In the initial state tasks look like this:
First of all, you need to free some space for baselines under the tasks. For this purpose, it's necessary to reduce the height of the task bar to make it equal to approximately a half of the row height:
gantt.config.bar_height = 16;
gantt.config.row_height = 40;
And move the task line to the top of the row by applying the following CSS code:
.gantt_task_line, .gantt_line_wrapper {
    margin-top: -9px;
}
.gantt_side_content {
    margin-bottom: 7px;
}
.gantt_task_link .gantt_link_arrow {
    margin-top: -12px
}
.gantt_side_content.gantt_right {
    bottom: 0;
}
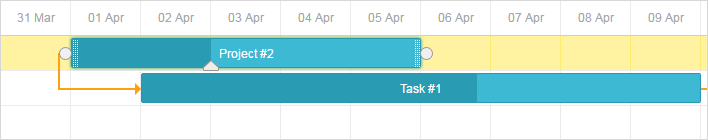
The result will be the following:
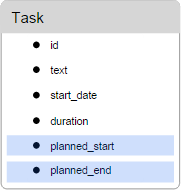
Step 2. Add additional data properties
After that, you need to add additional data properties to the task object. Let's name them: 'planned_start' and 'planned_end'.
Step 3. Convert added data properties to Date objects
dhtmlxGantt is aware just of the 'start_date' and 'end_date' data properties and automatically parse them to Date objects.
Any other date properties require additional processing.
To make the added 'planned_start', 'planned_end' properties recognizable by dhtmlxGantt,
parse them to Date objects with the help of the parseDate() method in the onTaskLoading event handler.
gantt.attachEvent("onTaskLoading", function(task){
    task.planned_start = gantt.date.parseDate(task.planned_start, "xml_date");
    task.planned_end = gantt.date.parseDate(task.planned_end, "xml_date");
    return true;
});
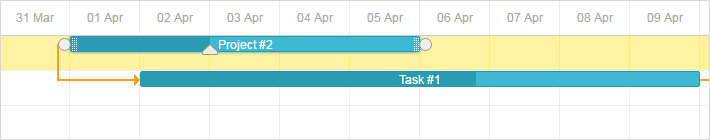
Step 4. Display custom elements for the planned time
Then, call the addTaskLayer method to display planned time for task (defined by the 'planned_start' and 'planned_end' properties).
gantt.addTaskLayer(function draw_planned(task) {
    if (task.planned_start && task.planned_end) {
        var sizes = gantt.getTaskPosition(task, task.planned_start, task.planned_end);
        var el = document.createElement('div');
        el.className = 'baseline';
        el.style.left = sizes.left + 'px';
        el.style.width = sizes.width + 'px';
        el.style.top = sizes.top + gantt.config.task_height  + 13 + 'px';
        return el;
    }
    return false;
});
Step 5. Specify the CSS rules for the added elements
Next, add a style for your new elements:
.baseline {
    position: absolute;
    border-radius: 2px;
    opacity: 0.6;
    margin-top: -7px;
    height: 12px;
    background: #ffd180;
    border: 1px solid rgb(255,153,0);
}
Step 6. Add the possibility to edit added data properties in the lightbox
Finally, redefine the lightbox structure if you want to provide a possibility to edit the newly added properties from UI.
gantt.config.lightbox.sections = [
    {name: "description", height: 70, map_to: "text", type: "textarea", focus: true},
    {name: "time", height: 72, map_to: "auto", type: "duration"},
    {name: "baseline", height: 72, map_to: {
        start_date: "planned_start", end_date: "planned_end"}, type: "duration"}
];
gantt.locale.labels.section_baseline = "Planned";
The full code of the considered example you can see in the related sample.
Related sample: Display project baseline
Samples of custom content
The following samples show you different ways of applying the addTaskLayer() method to enrich the timeline of the Gantt chart with different custom elements:
- Custom baselines
- Highlighting cells with overdue time
- Highlighting overdue tasks
- Showing the missed deadline for the whole project
- Displaying task progress value
- Adding custom elements for tasks
- Draggable baselines
- Baselines with a draggable progress knob
- Custom milestones
- Recurring tasks
Drag-and-drop for custom elements
It may be useful for you if we explore the question of enabling drag-and-drop for custom elements. The thing is that there is no built-in function for the implementation of a custom drag-and-drop in DHTMLX Gantt. But it can be done manually in a rather simple way.
Here you need to capture three DOM events (mousedown, mousemove, mouseup) and define a couple of flags to store the state of drag-and-drop between these events.
1. The mousedown event signals that drag-and-drop is starting. However, this may also be the first stage of a regular click event, which shouldn’t activate drag-and-drop. At this step, you have to set a flag, meaning that drag-and-drop is requested, and remember the initial mouse position as well as any other data that will be required later.
var dndRequested = false;
var dndActivated = false;
var startPosition = null;
var startTimestamp = null
var taskId = null;
var domUtils = gantt.utils.dom;
// in this sample we'll drag `.baseline` elements inside `gantt.$task_data` container
gantt.event(gantt.$task_data, 'mousedown', function(e) {
  // use element.closest or gantt.utils.dom.closest to locate the draggable element
  var draggableElement = domUtils.closest(e.target, '.baseline');

  if (draggableElement) {
    // we don't know yet whether a user is going to drag the element or just click it
    // store the event info, we'll check it at 'mousemove'
    dndRequested = true;
    startTimestamp = Date.now();
    startPosition = domUtils.getRelativeEventPosition(e, gantt.$task_data);
    taskId = draggableElement.getAttribute("data-task");
  }
});
Note that the event handler is added using gantt.event rather than native Element.addEventListener. It is done because Gantt can be destroyed using the gantt.destructor method and all events attached via gantt.event will be cleared automatically. If you use the native method and gantt.destructor, you may need to clear event handlers manually in order to avoid memory leaks.
2. The actual drag-and-drop will start in the mousemove handler. Instead of initiating drag-and-drop when a user clicks the mouse, compare the current mouse position with the initial position saved in mousedown. This way you can start drag-and-drop only when the current position differs enough from the initial one. If you don’t want to set a minimum threshold for drag-and-drop, you can also estimate the time passed since mousedown.
Once you determine that drag-and-drop has started, you can use the mousemove event handler to update the position of the dragged element on the screen. If you drag a custom layer element, the expected approach for refreshing it is to modify the underlying object and repaint it using Gantt API (gantt.refreshTask), rather than modifying the DOM element directly.
gantt.event(window, 'mousemove', function(e) {
  if (dndRequested && gantt.isTaskExists(taskId)) {
    // we captured 'mousemove' after 'mousedown' event
    var currentPosition = domUtils.getRelativeEventPosition(e, gantt.$task_data);
    if (!dndActivated) {
      // 'mousemove' may be a part of the regular click process,
      // we don't want to invoke dnd on regular click
      // we check whether mouse position has changed significantly,
      // or if the user holds a mouse longer than it usually happens for regular click
      if(Math.abs(
          currentPosition.x - startPosition.x) > 5 || (Date.now() - startTimestamp
        ) > 500) {
          // if so - we assume dnd has started
          dndActivated = true;
      }
    }
    if (dndActivated) {
      // here we can update the position of the dragged element.
      // when we drag an element added via `gantt.addTaskLayer`,
      // it's better to update the task object
      // and repaint it via `gantt.refreshTask`
      // you can also get the corresponding date of the time scale:
      var pointerDate = gantt.dateFromPos(currentPosition.x);
      gantt.getTask(taskId).baseline_date = pointerDate;
      gantt.refreshTask(taskId);
    }
  }

});
3. Finally, you should capture the mouseup event. If drag-and-drop has been started – apply changes to the moved object, call the gantt.updateTask method, if necessary, and clear all temporary flags.
gantt.event(window, 'mouseup', function(e) {
  // apply changes if drag-and-drop was in progress
  if (dndActivated) {
    // validate and finalize changes if needed
    var task = gantt.getTask(taskId);
    task.baseline_date = gantt.roundDate({
      date: task.baseline_date,
      unit: "hour",
      step: 1
    });
    // call gantt.updateTask to invoke the update of data
    gantt.updateTask(taskId);
  }
  // clear all flags we've set at previous stages
  dndRequested = false;
  dndActivated = false;
  startPosition = null;
  startTimestamp = null;
  taskId = null;
});
Extra overlay for the chart
dhtmlxGantt provides the possibility to add an extra layer over the Gantt Chart for placing some custom content into it. As an overlay you can use a div container, an HTML canvas, etc. To draw the overlay content, any third-party library can be used.
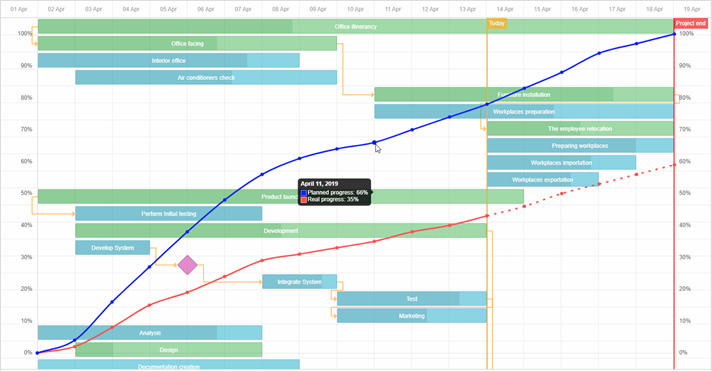
For example, you can add an S-curve into the extra overlay. Generally, S-curves display the growth of expenses, decrease of supplies of materials, etc., and allow tracking the common progress of implementing tasks of a project.
To add an overlay into gantt, you need to complete two steps:
- enable the overlay extension using the gantt.plugins method
gantt.plugins({
    overlay: true
});
- use the addOverlay() method of the gantt.ext.overlay object and pass a function that contains the logic of adding overlay content into it. This function takes a container with custom content as a parameter. See examples below.
The following example demonstrates how you can add a canvas overlay with S-curves for displaying the target and actual progress of the project (implemented with the help of the ChartJS library):
var overlay = gantt.ext.overlay.addOverlay(function(container){
    var canvas = document.createElement("canvas");
    container.appendChild(canvas);
    canvas.style.height = container.offsetHeight + "px";
    canvas.style.width = container.offsetWidth + "px";

    var ctx = canvas.getContext("2d");
    var myChart = new Chart(ctx, {
        type: "line",
        // full chart configuration
    });
});
The gantt.ext.overlay.addOverlay() method returns the id of a new overlay as a number.
Related sample: Gantt chart with overlay and zoom
Overlay extension API
The dhtmlxgantt_overlay extension contains a set of API methods to simplify work with overlays. These methods are available via the gantt.ext.overlay object.
addOverlay
adds a new overlay into the Gantt Chart and returns its id. Takes a container with custom content as a parameter.
var overlay = gantt.ext.overlay.addOverlay(function(container){});
deleteOverlay
removes an overlay by its id
gantt.ext.overlay.deleteOverlay(id);
getOverlaysIds
returns an array with ids of overlays added into the chart
var ids = gantt.ext.overlay.getOverlaysIds();
refreshOverlay
repaints the specified overlay. Takes the id of an overlay as a parameter.
gantt.ext.overlay.refreshOverlay(id);
showOverlay
shows an overlay by its id. Takes the id of an overlay as a parameter.
gantt.ext.overlay.showOverlay(id);
hideOverlay
hides an overlay by its id
gantt.ext.overlay.hideOverlay(id);
isOverlayVisible
checks visibility of the specified overlay. Returns true if the overlay is visible.
var isVisible = gantt.ext.overlay.isOverlayVisible(id);