DHTMLX Diagram overview
DHTMLX Diagram is a client-side chart component that allows you to display relations between some objects, concepts or living beings in a visual form: as a scheme, chart, organizational chart, mind map, etc. The diagram makes it easier to present tangled and bulky information in a simple and accessible way.
Diagram in the default mode
DHTMLX Diagram provides the possibility to make various diagrams using a predefined set of shapes and connectors, and experiment with their look and feel.
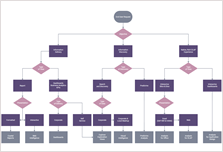
You can choose shapes of desired types, link them by suitable connectors and build any type of a diagram that will show the sequence of some operations making up a particular process, like this:
| Data Planning Model | Vertical Decision Tree | Wide Flowchart |
|---|---|---|
 |  | 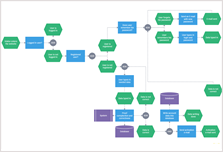 |
| Decision Tree | Activity Diagram |
|---|---|
 |  |
Custom shapes
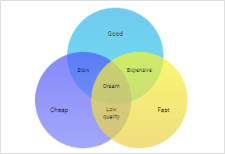
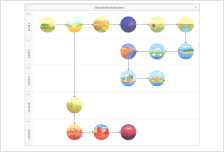
You can create your own templates of shapes and use them to design any diagram you need. For example, you can create such well-known custom diagrams as:
| Life Cycle Diagram | Venn Diagram template | UML Class Diagram template |
|---|---|---|
 |  |  |
| Network Diagram template | Game levels and locations |
|---|---|
 |  |
Groups
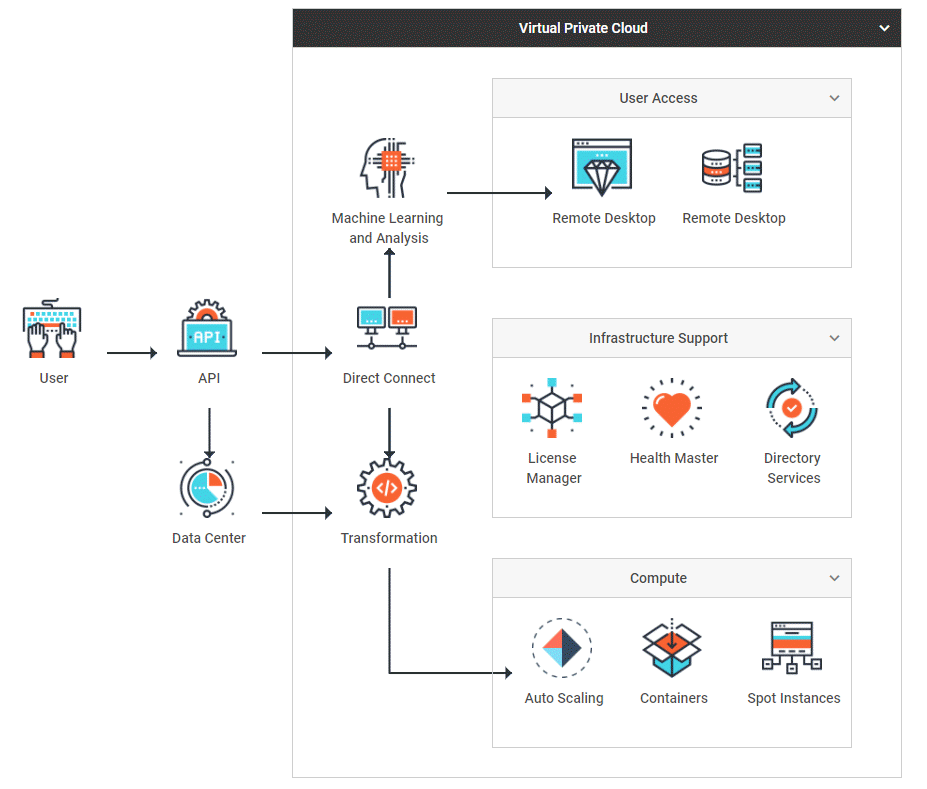
You can draw simple or more complicated schemes by grouping shapes in different ways with the help of such an element of Diagram as a group. You can create both one-level and nested groups, and configure their appearance and behavior. Check the details in the Groups article.
| Diagram Editor. Default mode. Virtual private cloud architecture |
|---|
 |
Swimlanes
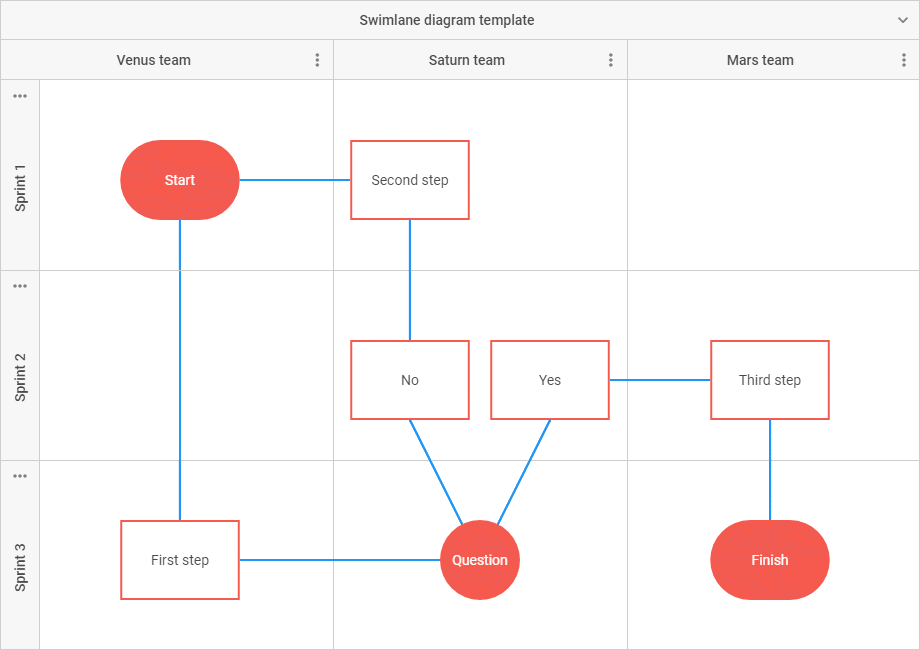
Swimlanes in the DHTMLX Diagram library let you represent any process (business, manufacturing, service, or any other) or its separate parts from start to finish. Check the details in the Swimlanes article.
| Diagram. Default mode. Swimlane template |
|---|
 |
Line titles
Line titles are enabled in the default mode of Diagram. You can add text by double-clicking on a line. You can also use double-clicking to edit the text. Check the details in the LineTitles article.
Diagram in the org chart mode
There is also an org chart mode of Diagram that presents a set of shapes connected by lines in a hierarchical order.
Assistant and partner shapes
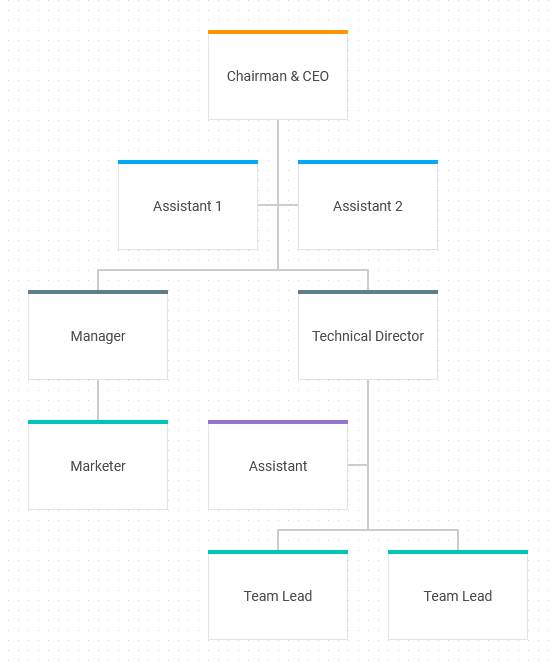
A parent shape of any level can have assistant or partner items. The assistant and partner shapes can't be parent items. The assistant and partner items can be added in the editor or by preparing a data set.
In the hierarchical order, the assistant items are displayed between parent and children shapes.
| Diagram editor. Org chart mode. Basic initialization |
|---|
 |
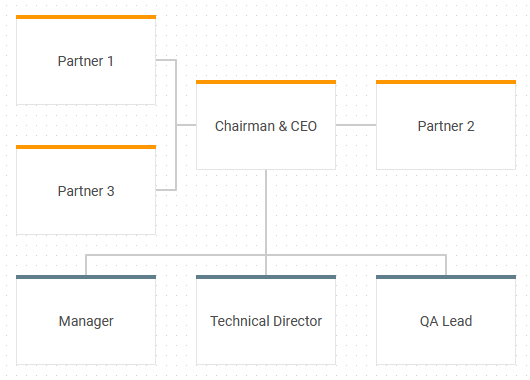
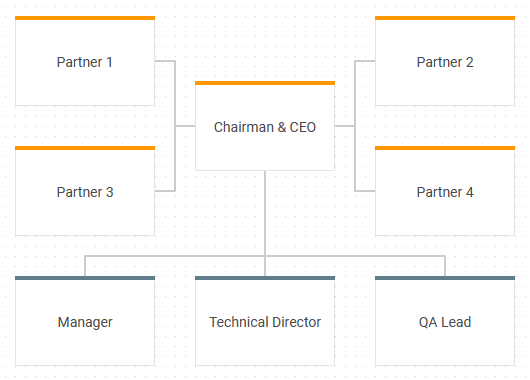
The connection between parent shape and its partner items is always horizontal. Also, the connections between parent shape and all its children become horizontal when you add the partner item for a parent, even if the connections were vertical before.
The partner shapes are very useful for building a family tree.
Related sample: Diagram editor. Org chart mode. Family tree
Here are examples of how the connections of parent shapes look with one, two, three, and four partners.
| One partner | Two partners |
|---|---|
 |  |
| Three partners | Four partners |
|---|---|
 |  |
Custom shapes
An example of adding custom shapes for creating a diagram to present the hierarchical organizational structure of a medical institution:
| Diagram Editor. Org chart mode. Medical hierarchy diagram template |
|---|
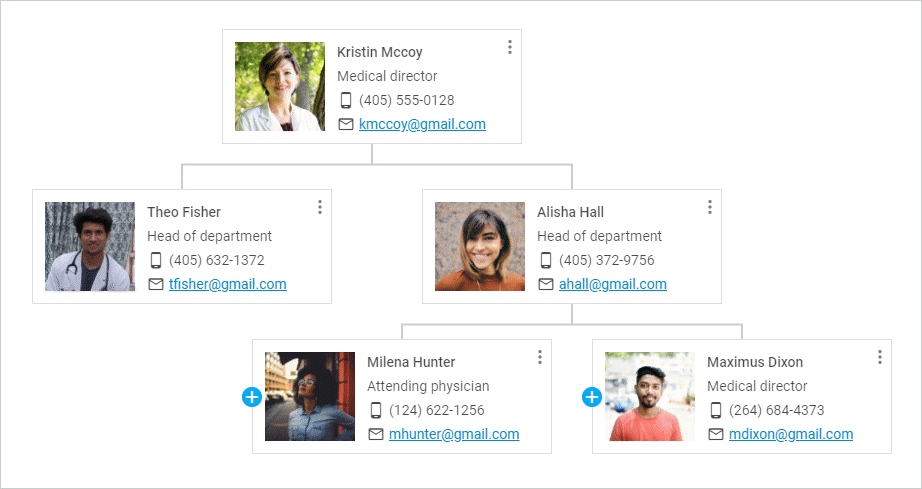 |
Diagram in the mindmap mode
The Mindmap mode is used to represent a core topic or idea surrounded by the branches of the subtopics.
| Diagram. Mindmap mode. Emotions mind map |
|---|
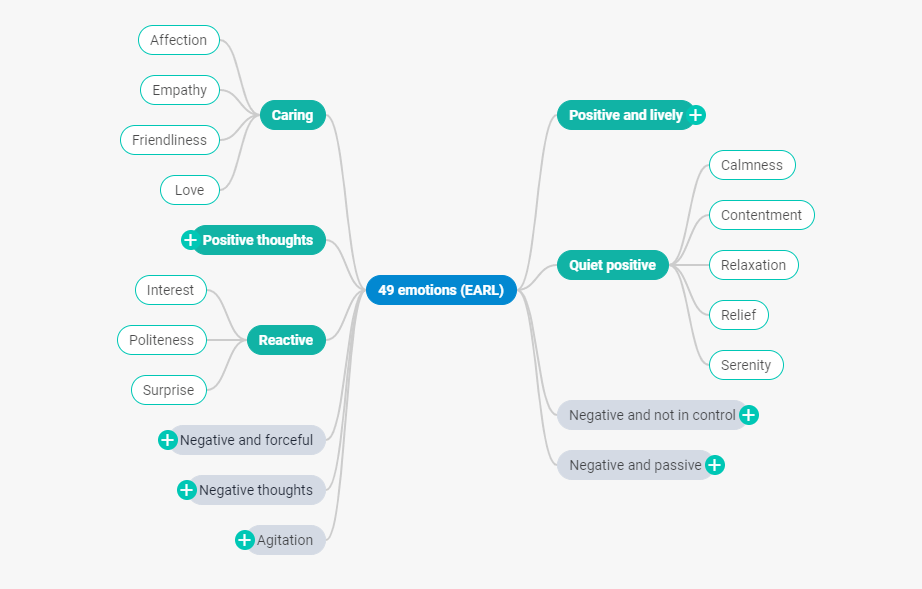 |
The shapes are connected by curved lines and arranged around a central shape of the diagram.
Custom shapes
An example of adding a custom template into the mindmap mode of the diagram to create a site map:
Diagram in the PERT mode
The PERT mode is used to visualize tasks and projects' sequences and connections between them. It is also useful for identifying the critical path and project planning.
Diagram in the PERT mode uses the DHTMLX Gantt data structure, which provides easy interaction between the components. On loading a Gantt dataset, a Diagram in the PERT mode automatically arranges tasks and projects based on the connections between them.
Integrating PERT Diagram and DHTMLX Gantt
An example of integrating a Diagram in the PERT mode and a Gantt chart is given below:
Shape search
DHTMLX Diagram provides you with a set of API that you can apply to make working with a Diagram more convenient. For example, you can implement a shape search feature that helps you simplify work with large diagrams.
Diagram scale
You can apply the zoom template to your diagram to change its appearance by zooming in or out. You can also let the user get detailed information on the selected shape.
What's next
Now you can learn about using DHTMLX Diagram Editor in your application. Read the Diagram Editor overview to learn more about this tool. If you build with an AI coding assistant, connect it to the live documentation through the DHTMLX MCP server.