Professional demos
4 examples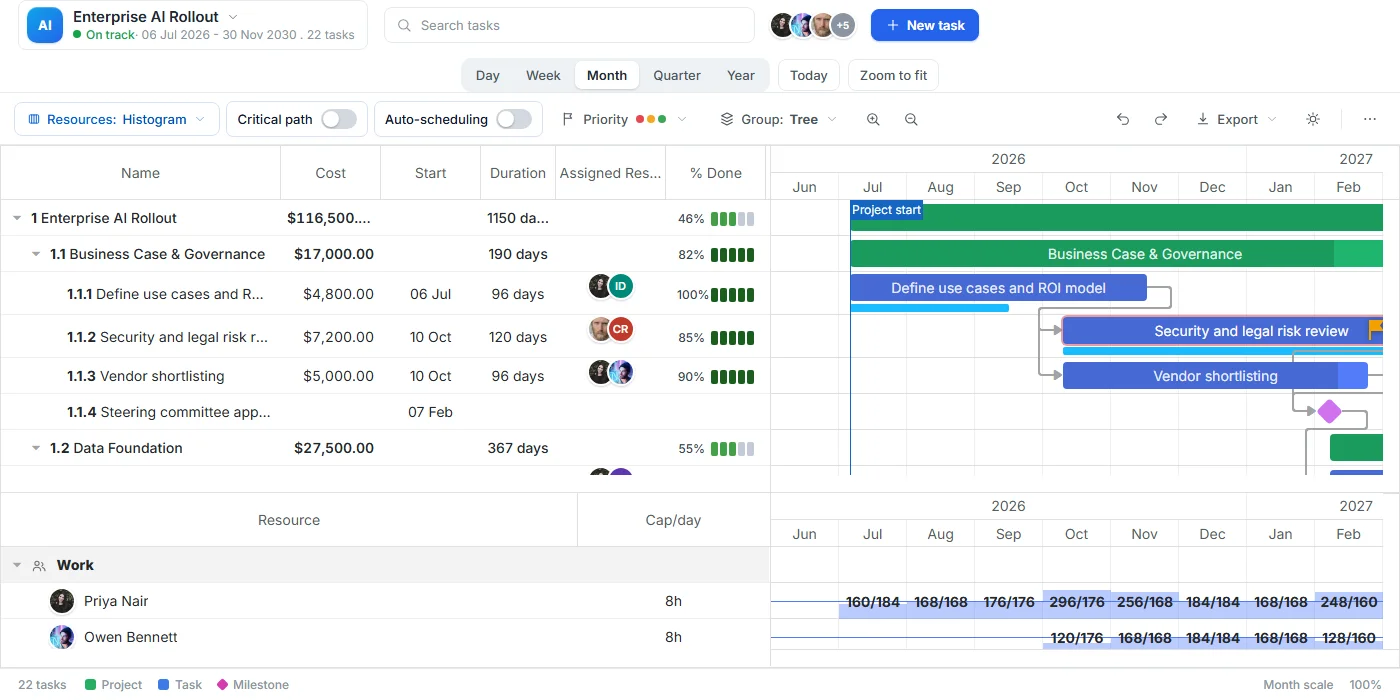
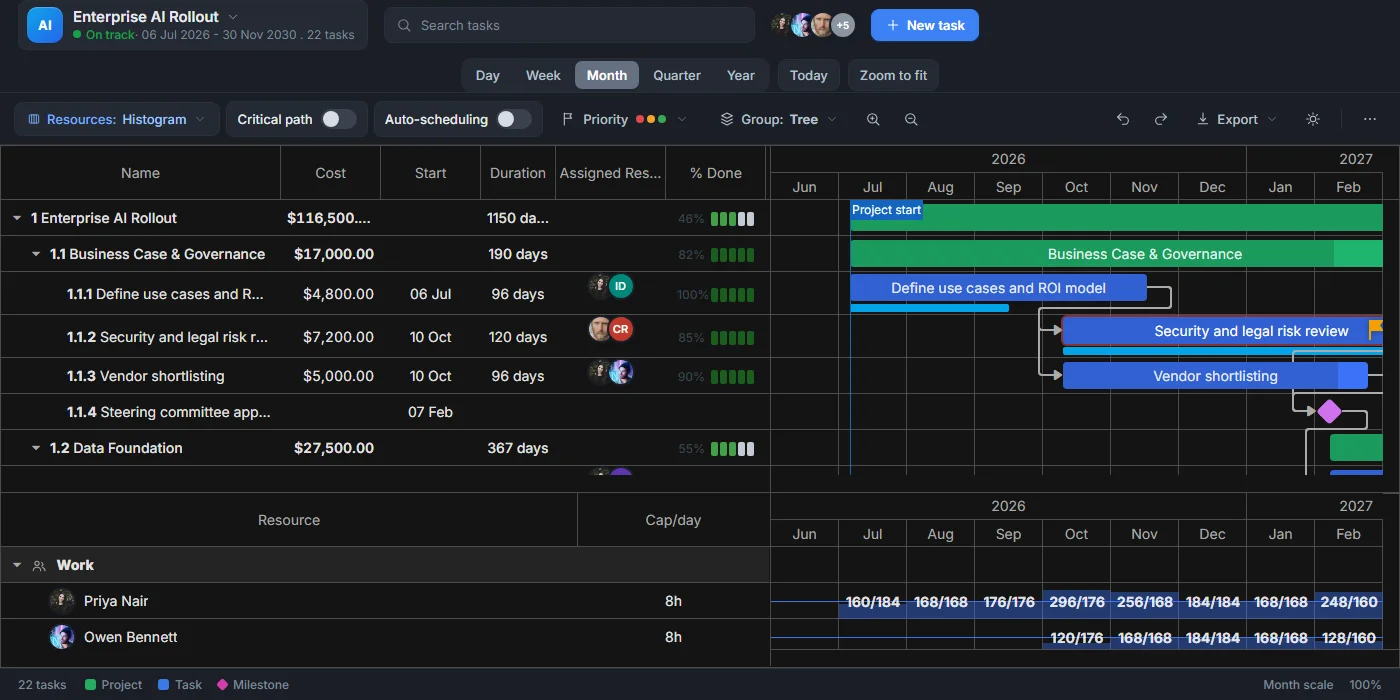
Enterprise Gantt demo
A comprehensive Gantt chart demo featuring tasks, dependencies, auto scheduling, a resource histogram, and interactive controls.
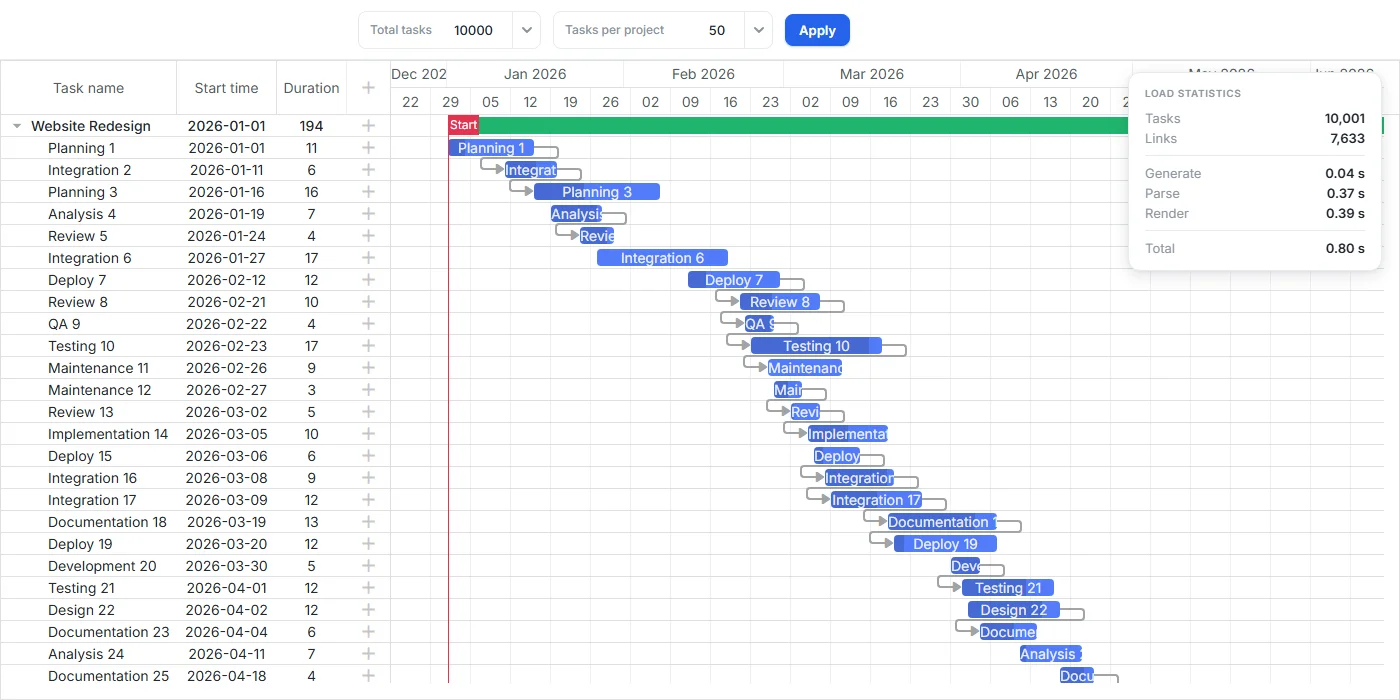
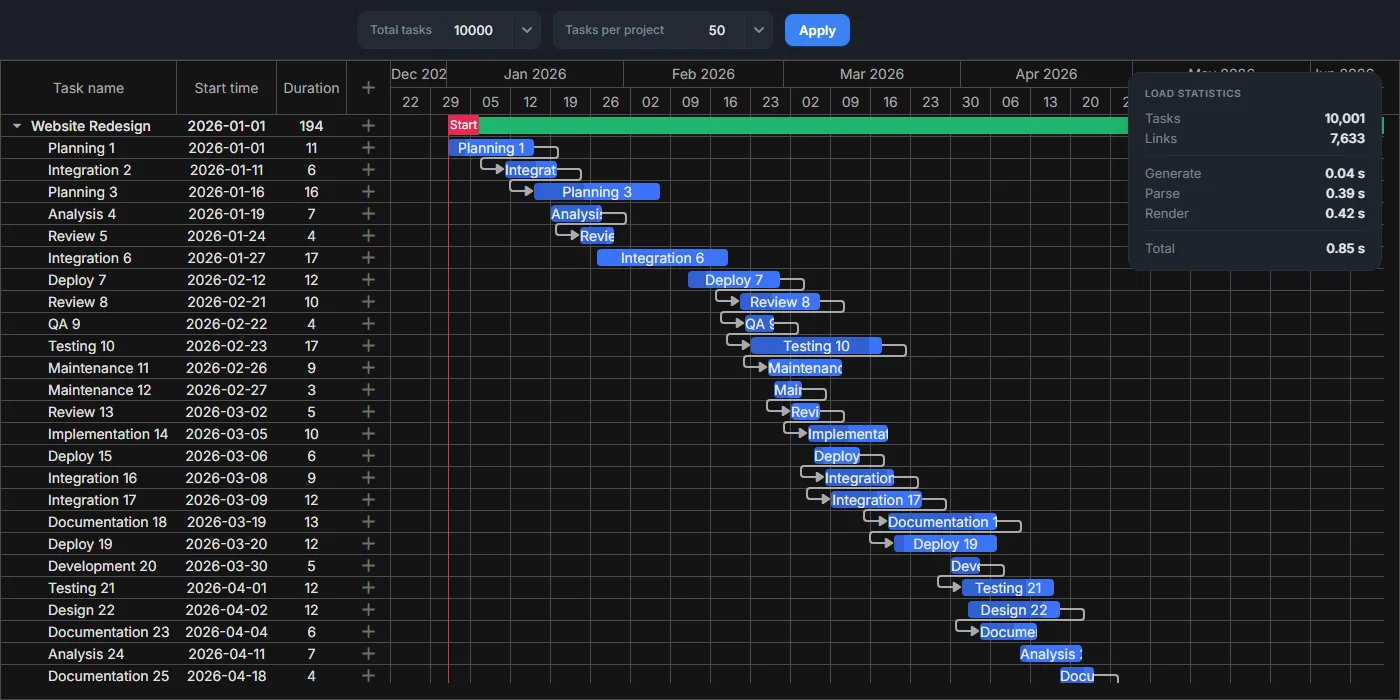
Big dataset
Demonstrates DHTMLX Gantt performance with a large number of tasks and links, featuring optimized rendering.
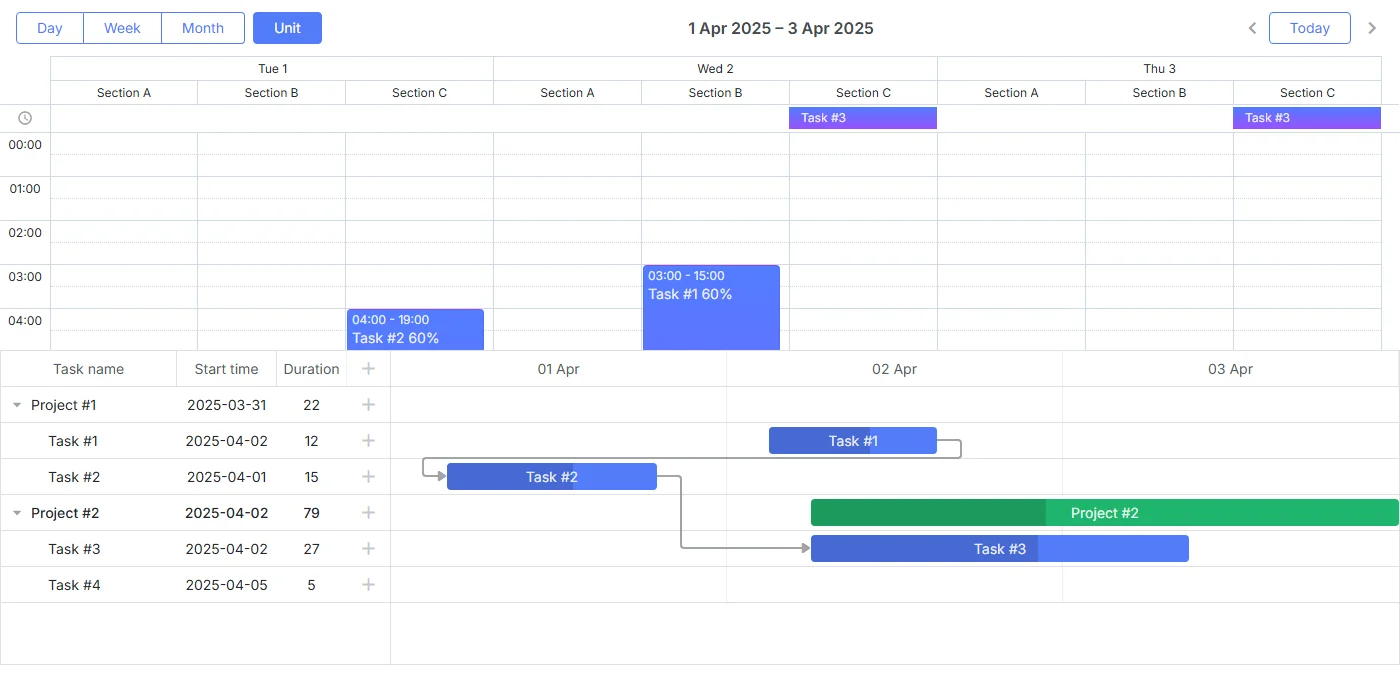
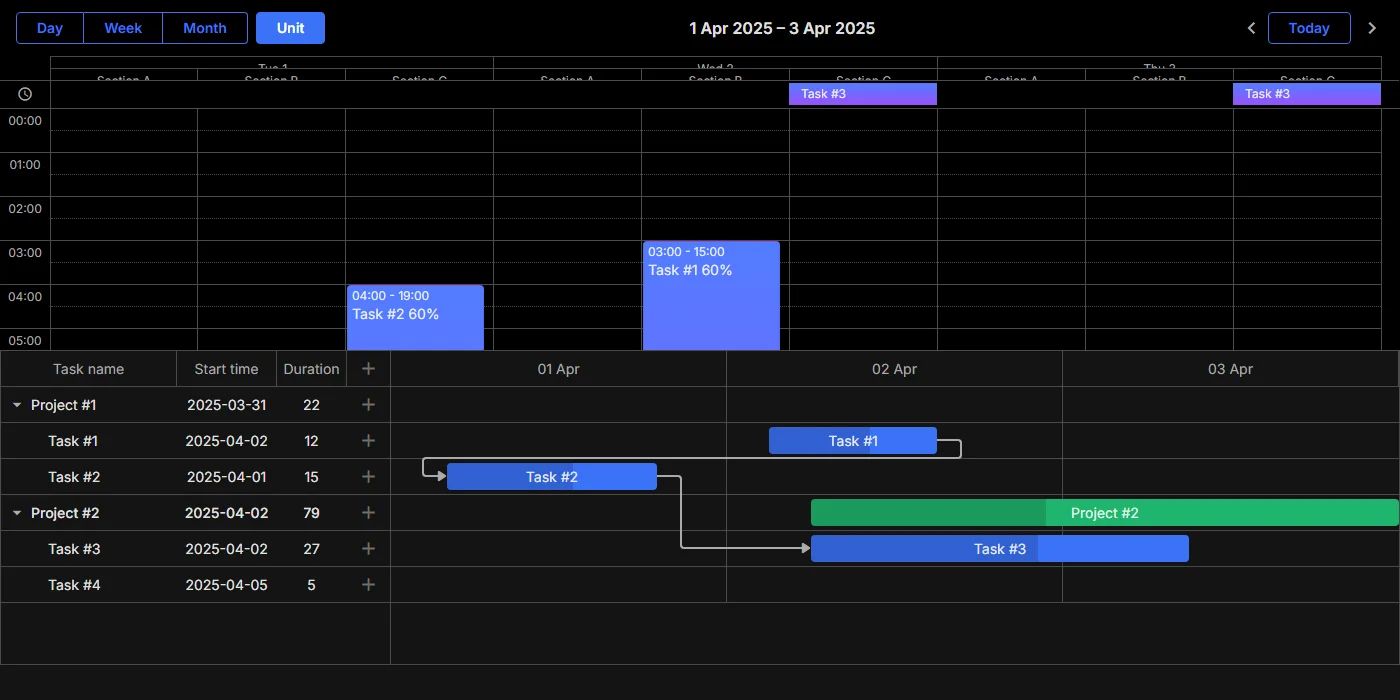
Gantt + Scheduler synchronization
Synchronize tasks and events between DHTMLX Gantt and Scheduler components in a shared view.
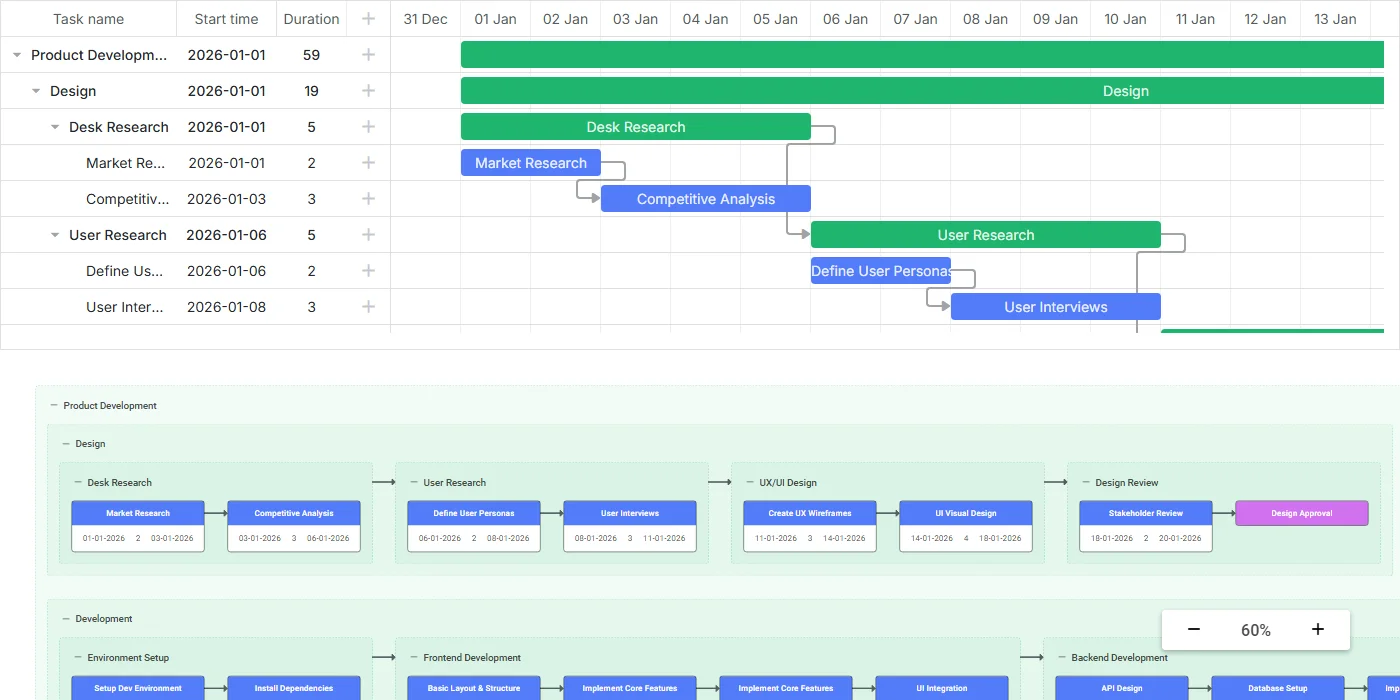
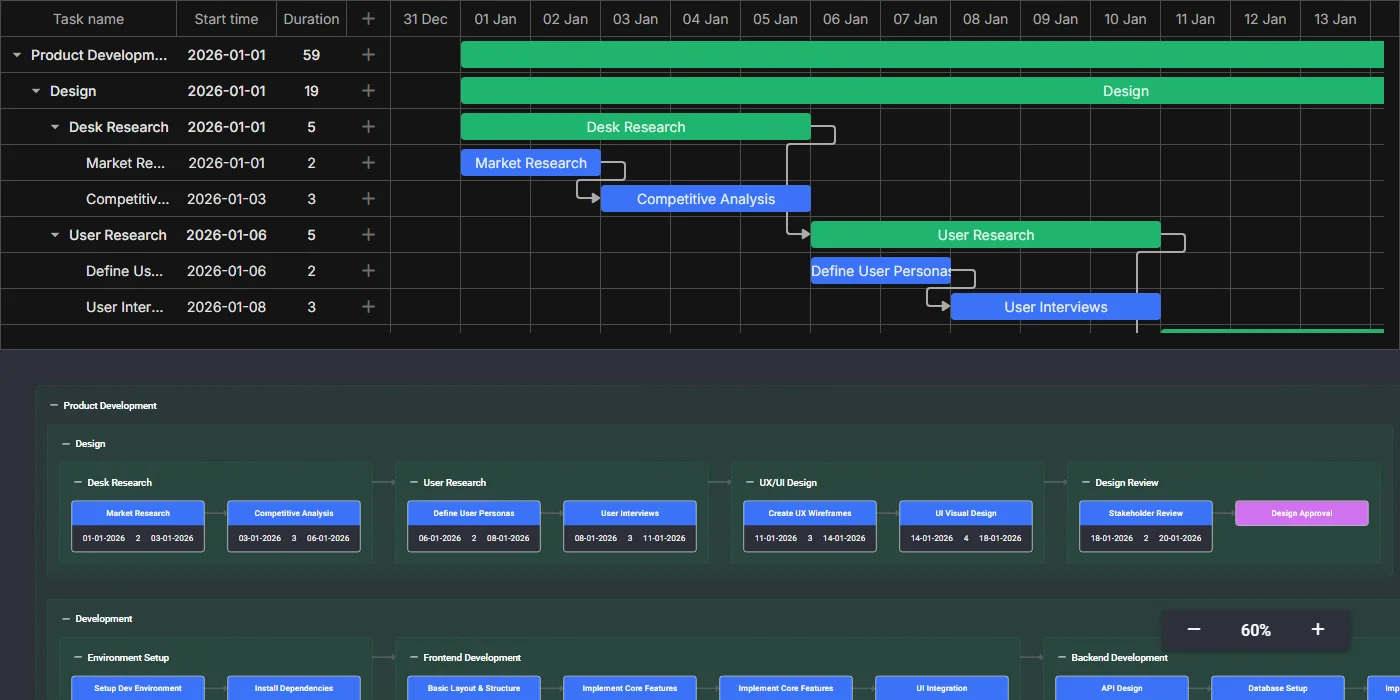
PERT chart
Visualize project dependencies as a PERT chart using the DHTMLX Diagram component alongside the Gantt chart.
AI
3 examples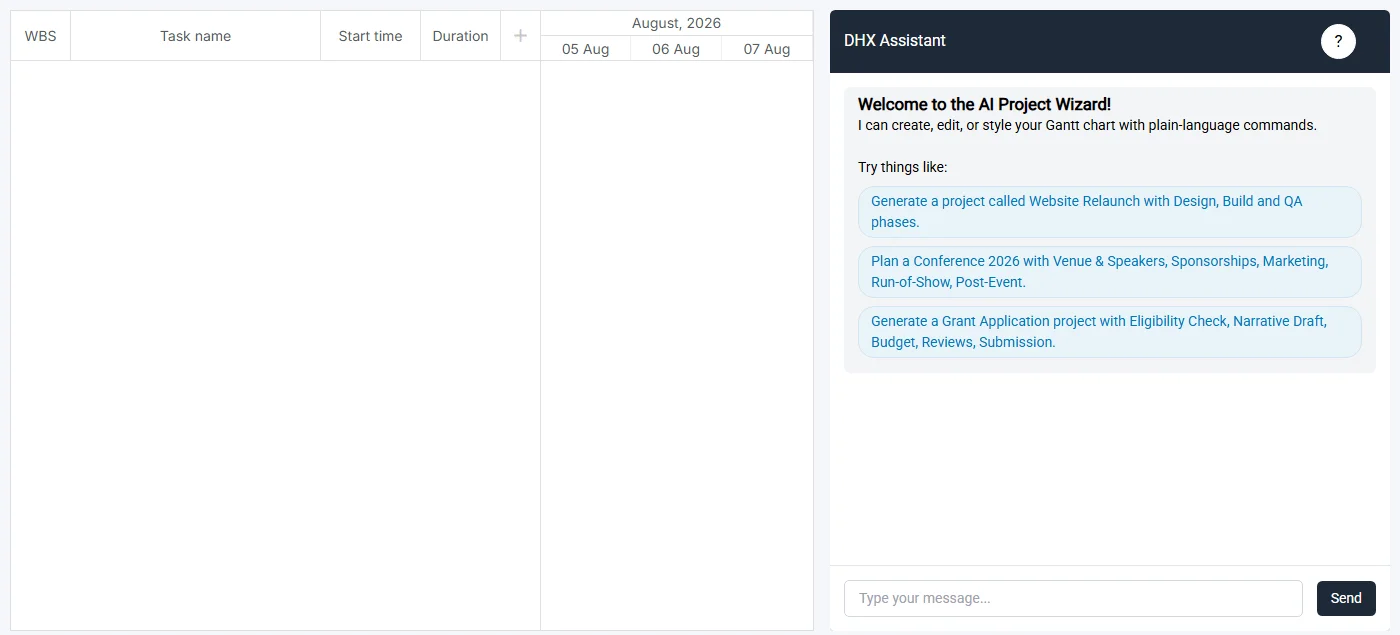
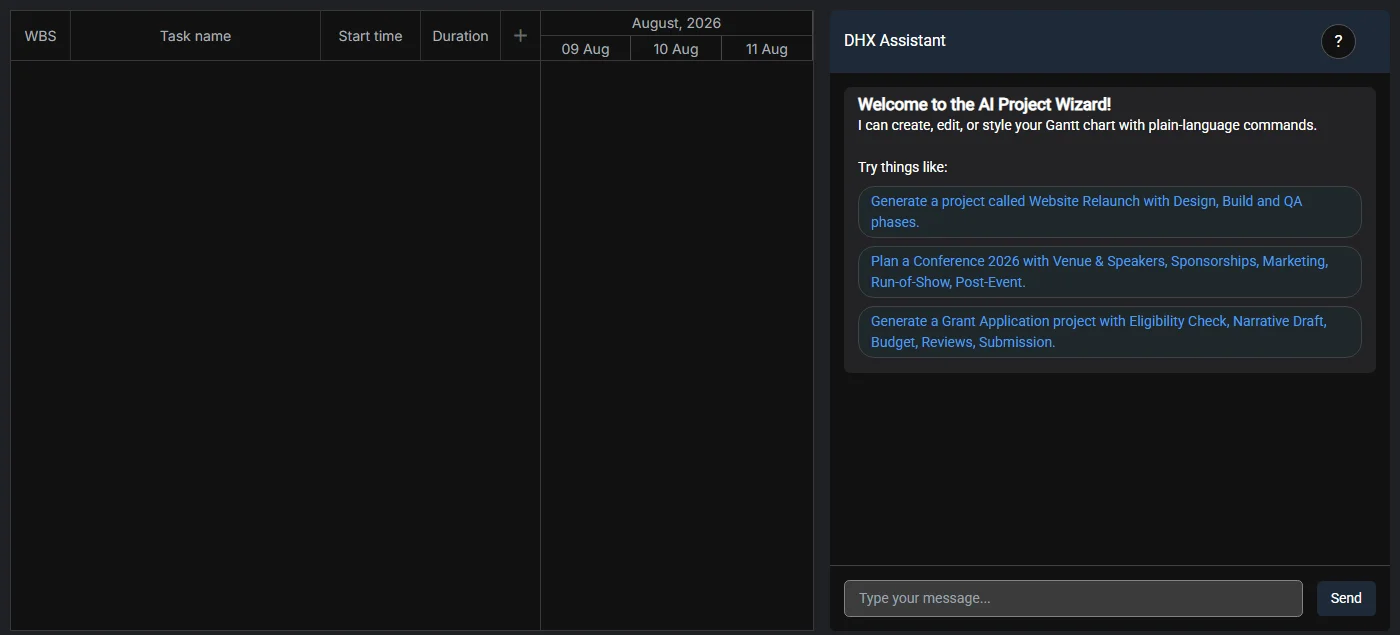
AI Gantt maker
Control a DHTMLX Gantt chart with a natural-language AI assistant that can generate projects, manage tasks, update links, and customize the timeline.
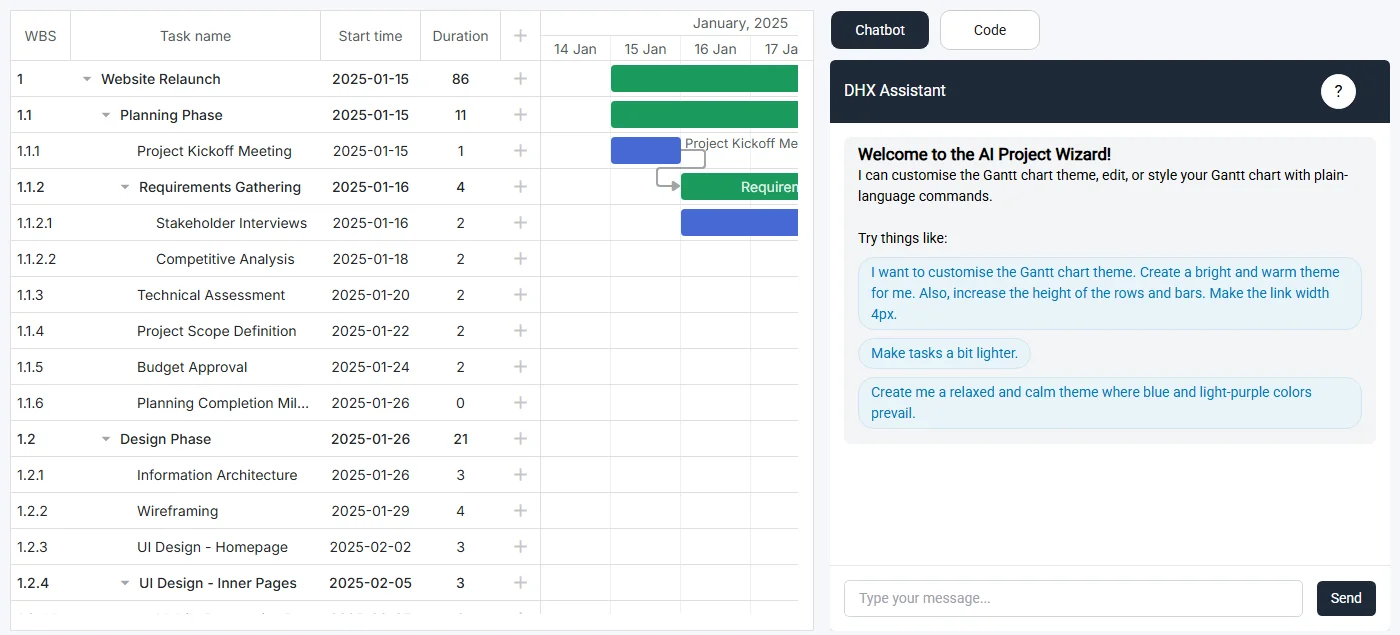
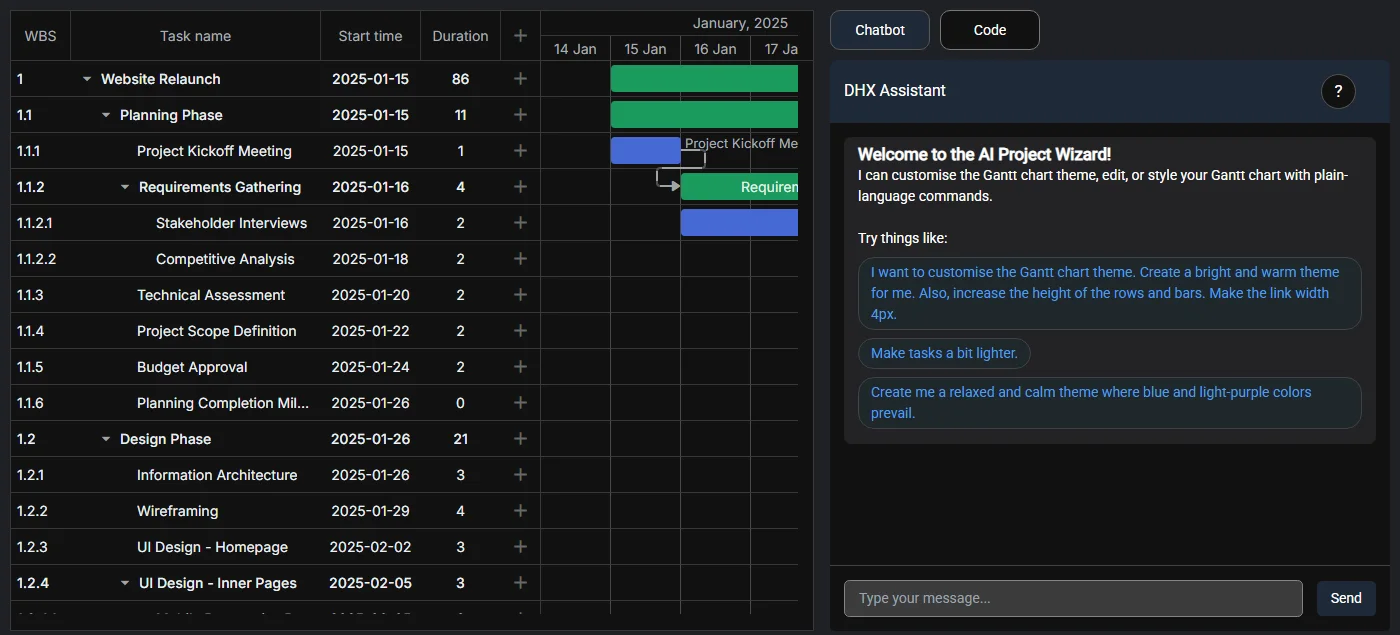
AI theme builder
Customize DHTMLX Gantt themes and configuration through an AI chat assistant, then inspect and fine-tune the generated CSS variables and config code.
AI semantic search
Search Gantt tasks by meaning instead of keywords, using locally generated embeddings from an Ollama model matched against precomputed task vectors.
Popular features
31 examples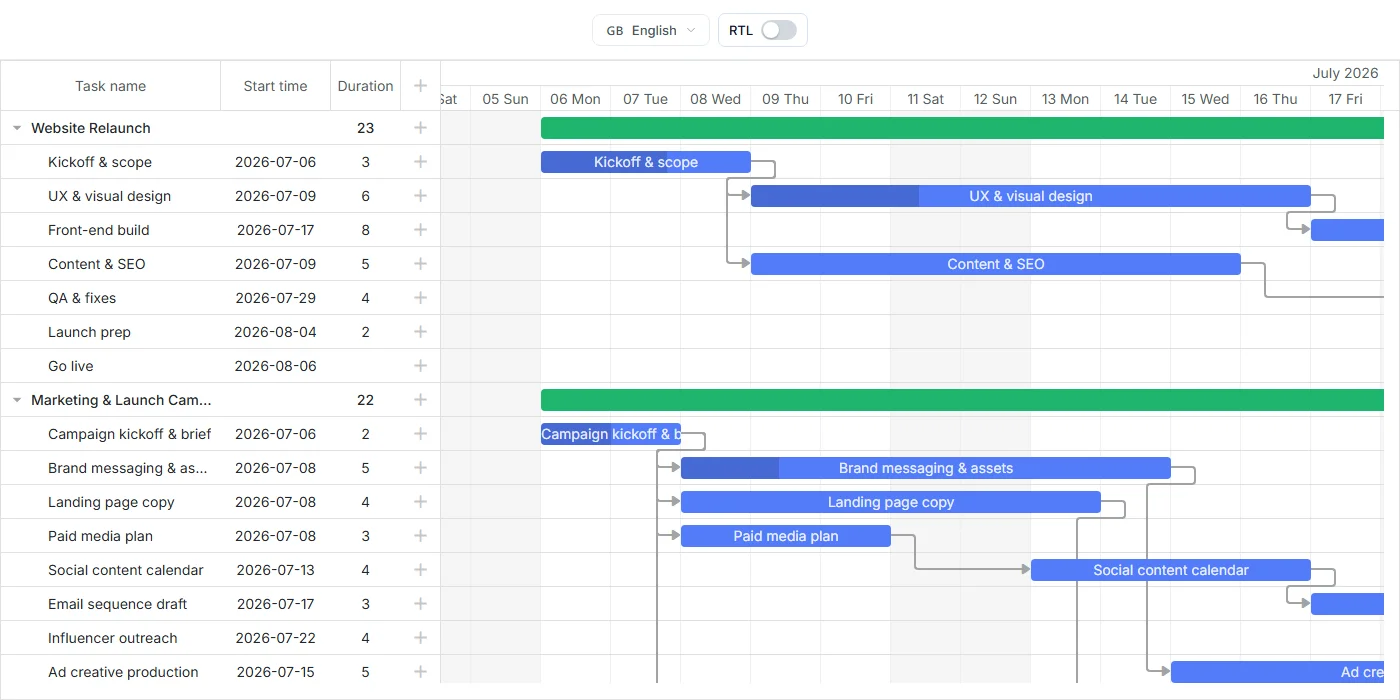
Dynamically switch locale
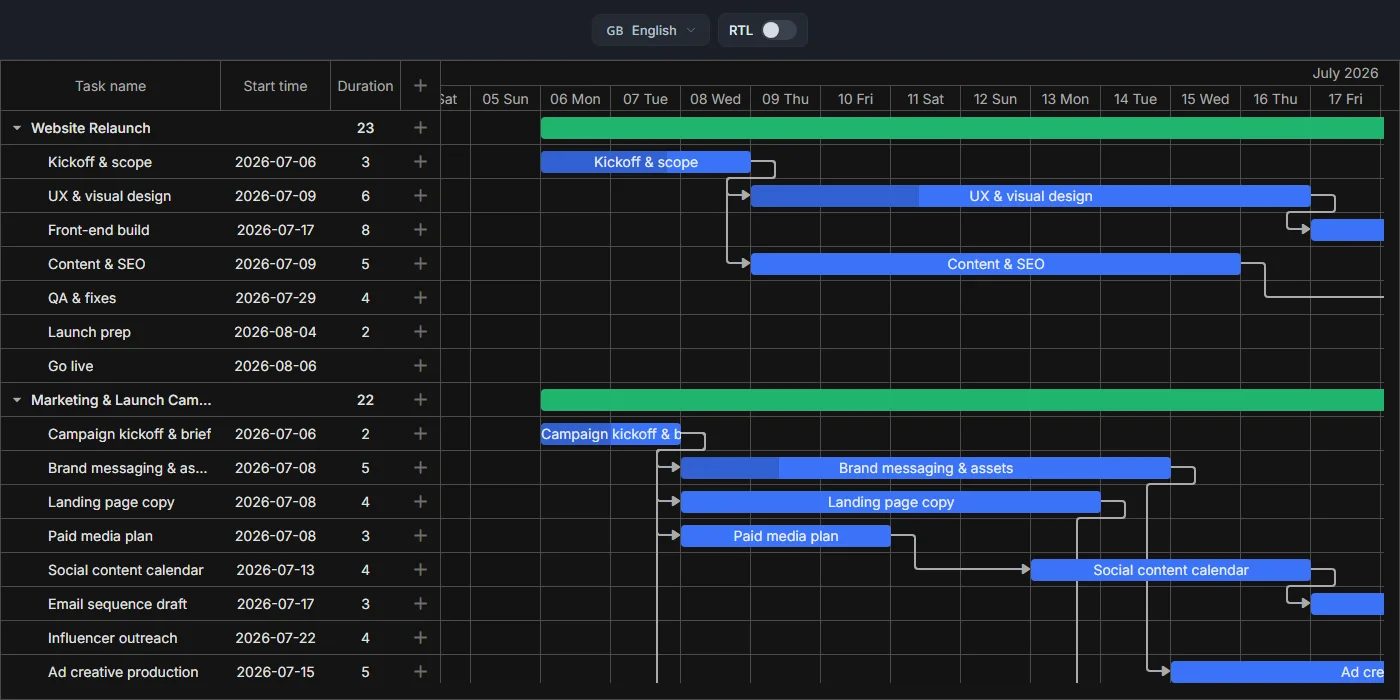
Switch the interface language while the page is running, and mirror the layout for right to left languages.
Critical path and slack
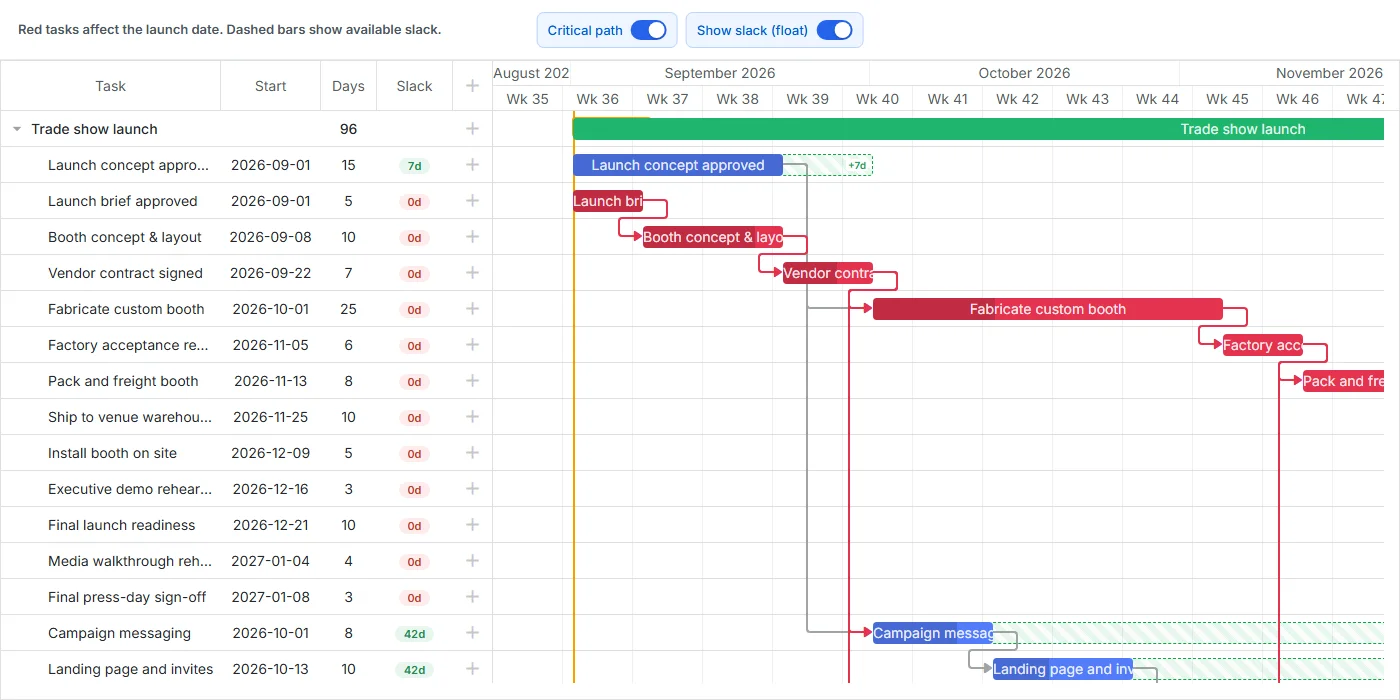
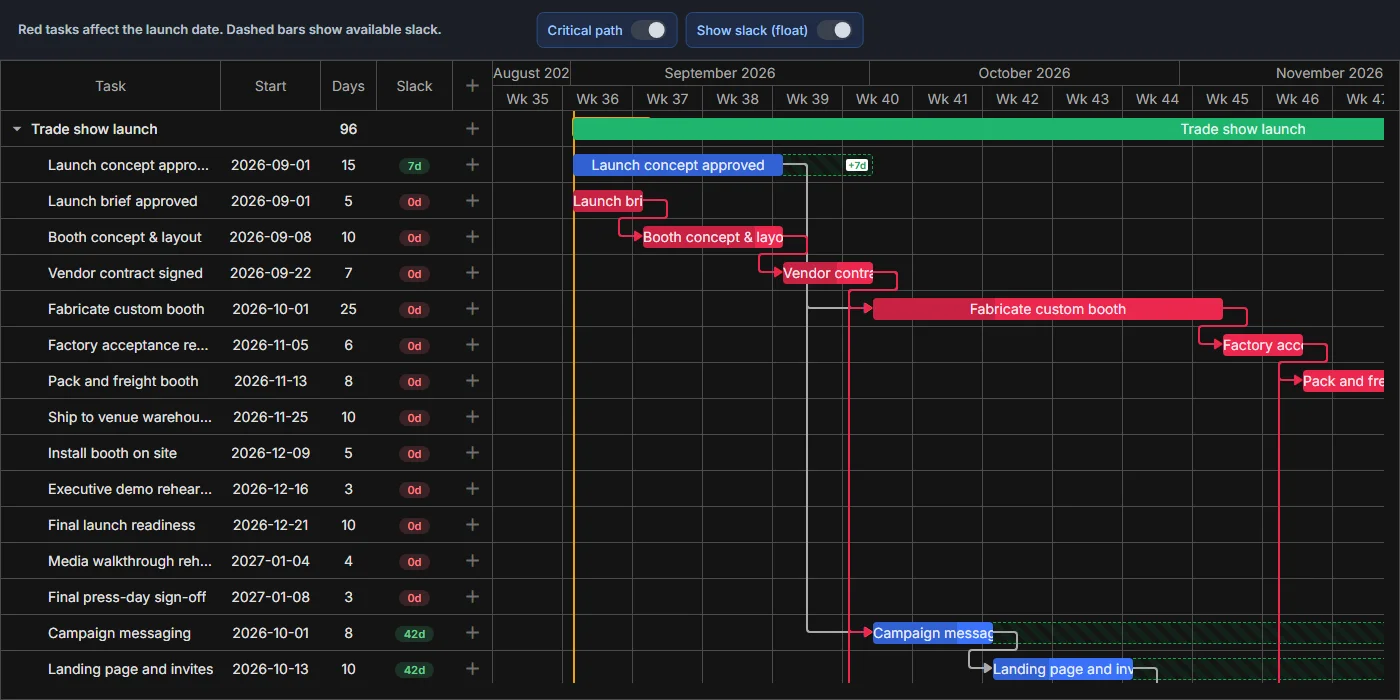
Highlight the chain of tasks that drives the finish date, and show how much room every other task still has.
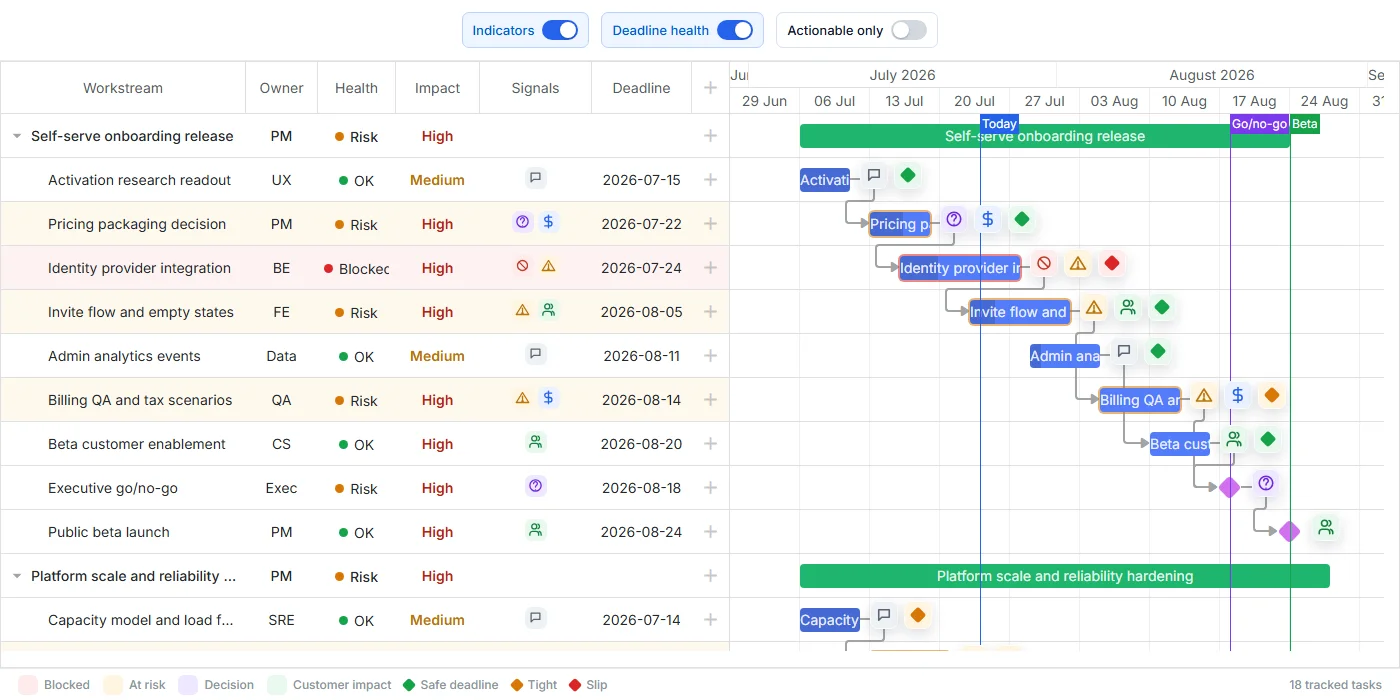
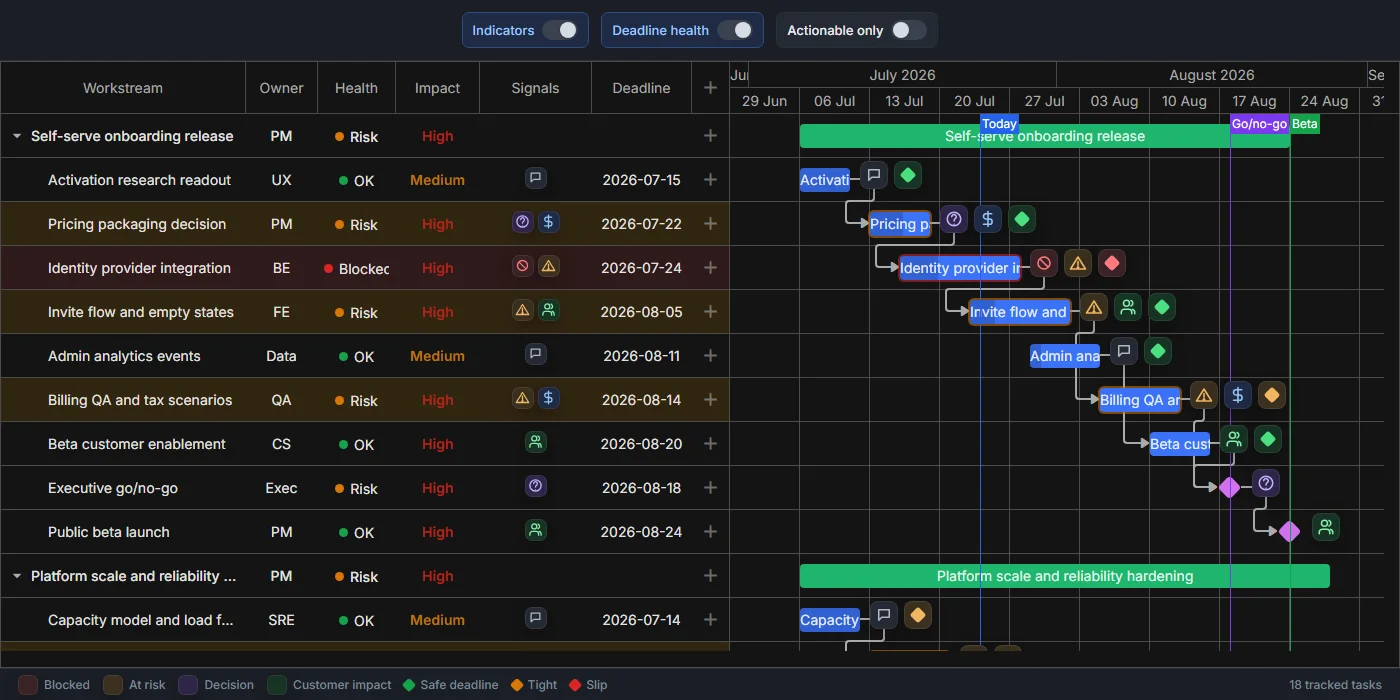
Health indicators
Flag risk, blockers, decisions, and budget on each row, and score every task as met, tight, or slipping against its deadline.
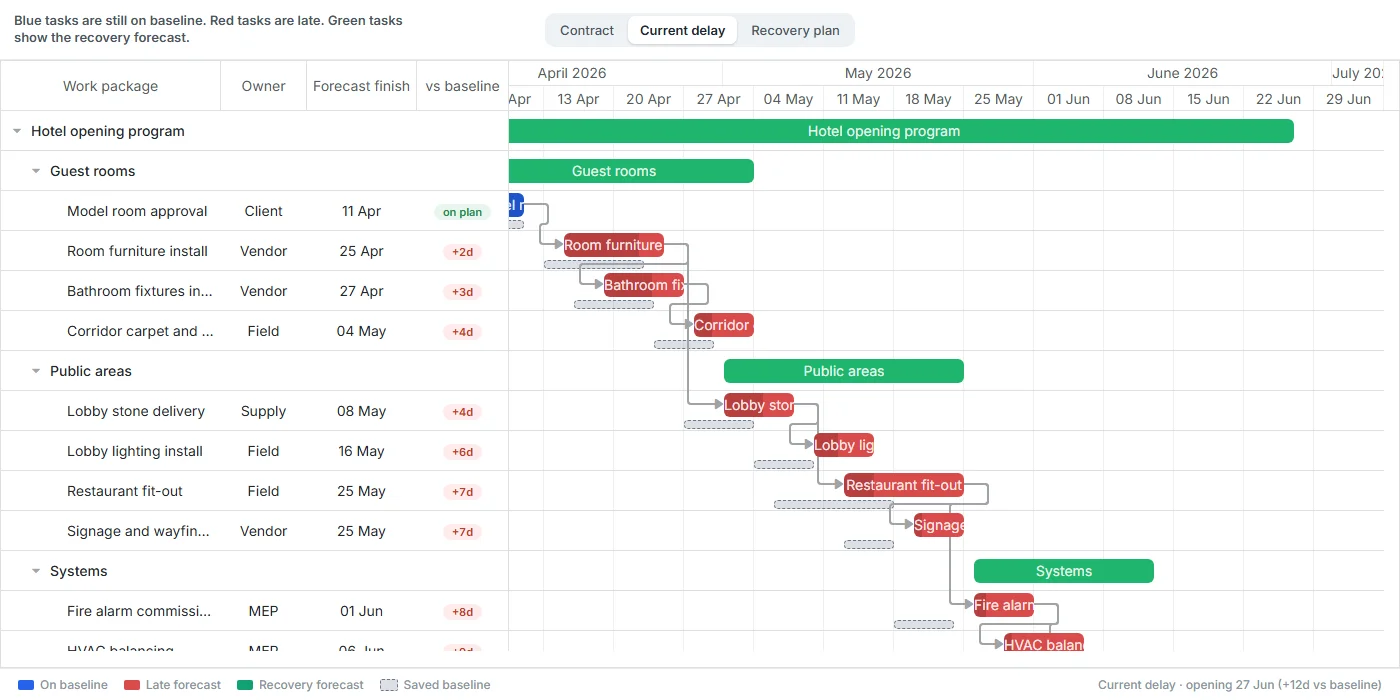
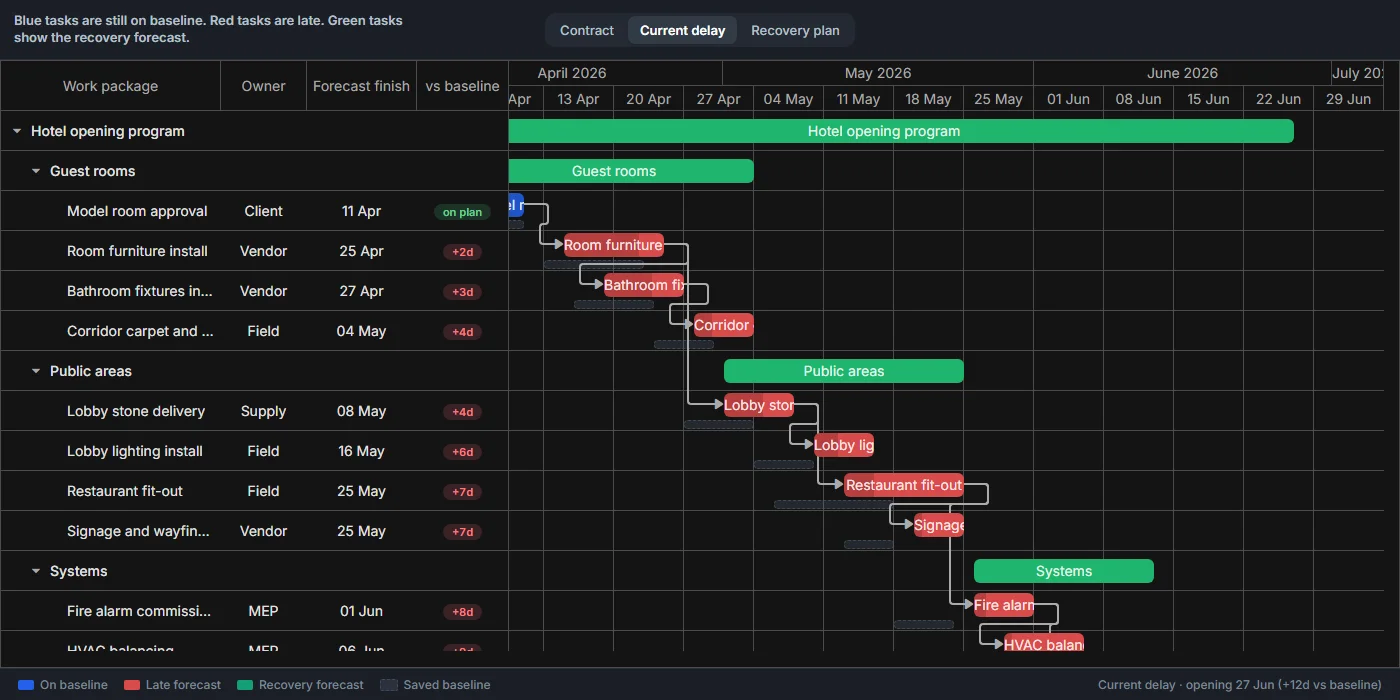
Baselines and recovery
Keep one approved baseline and switch the live schedule between the contract plan, a delayed forecast, and a recovery plan.
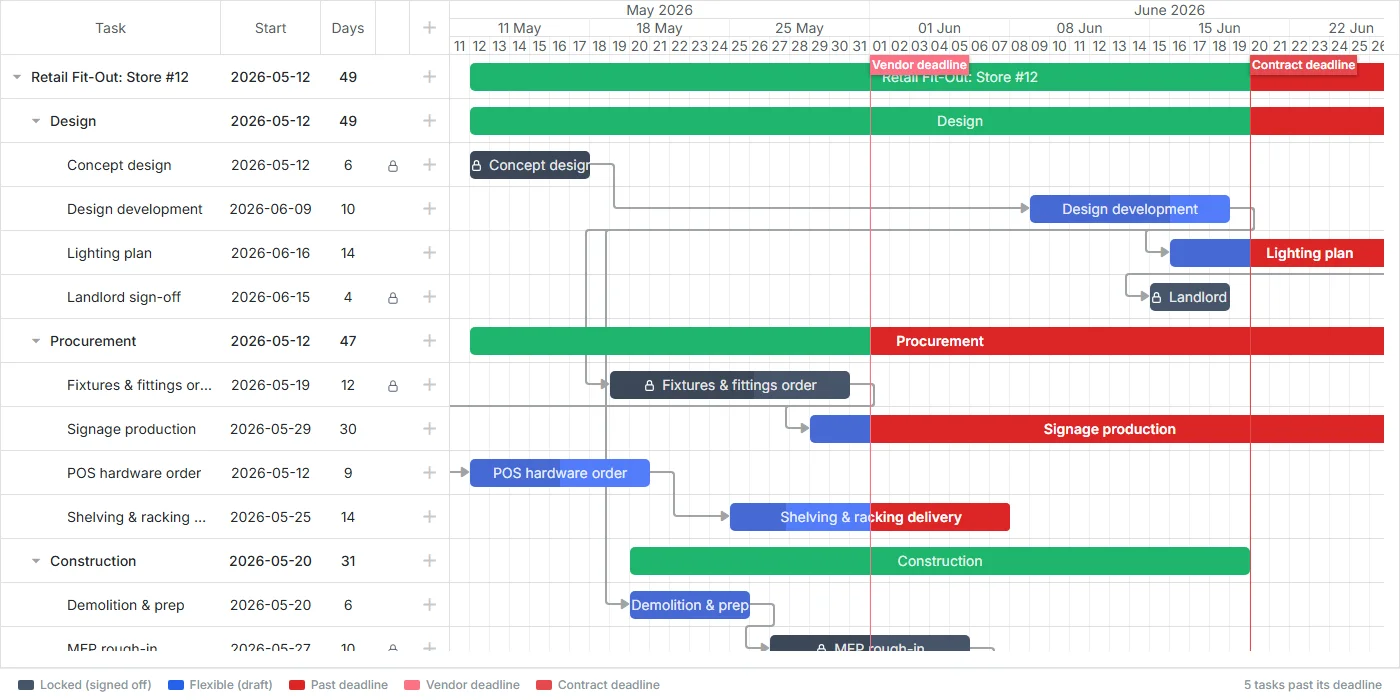
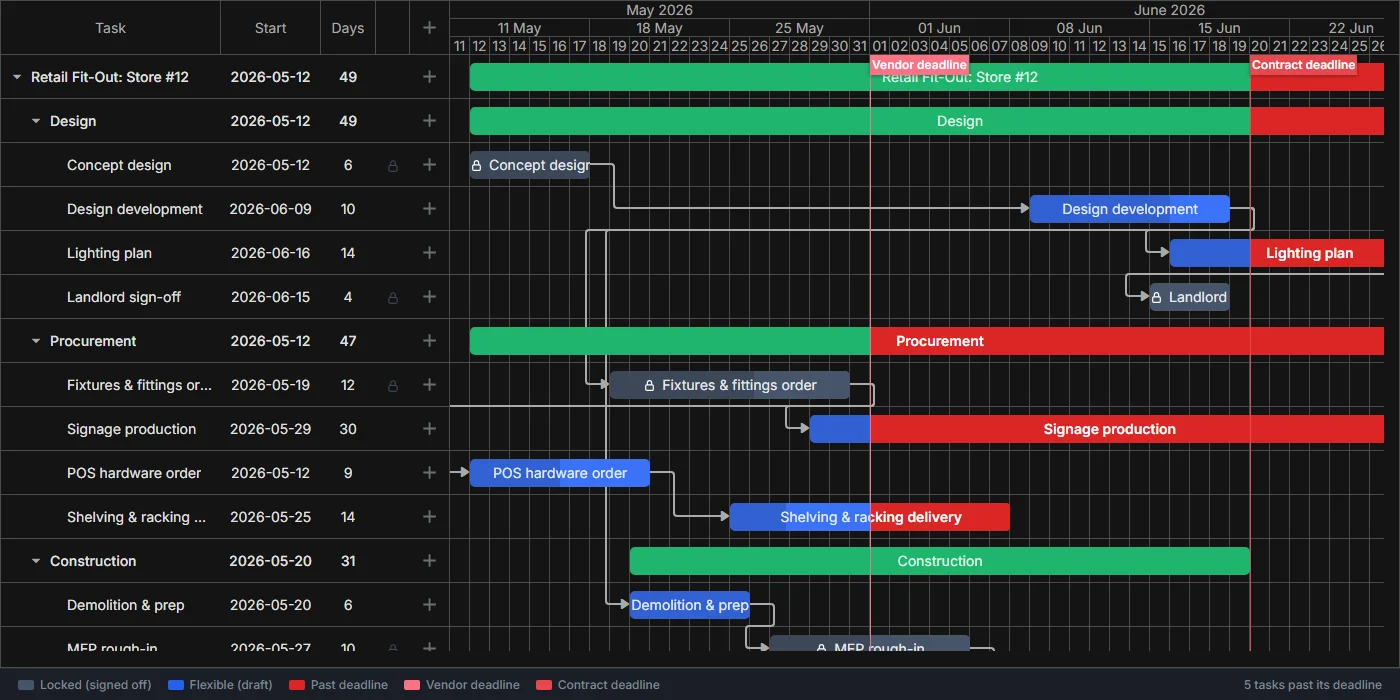
Deadlines and task locking
Snap a locked task back when a drag would cross its deadline, and mark the overrun on tasks that are free to move.
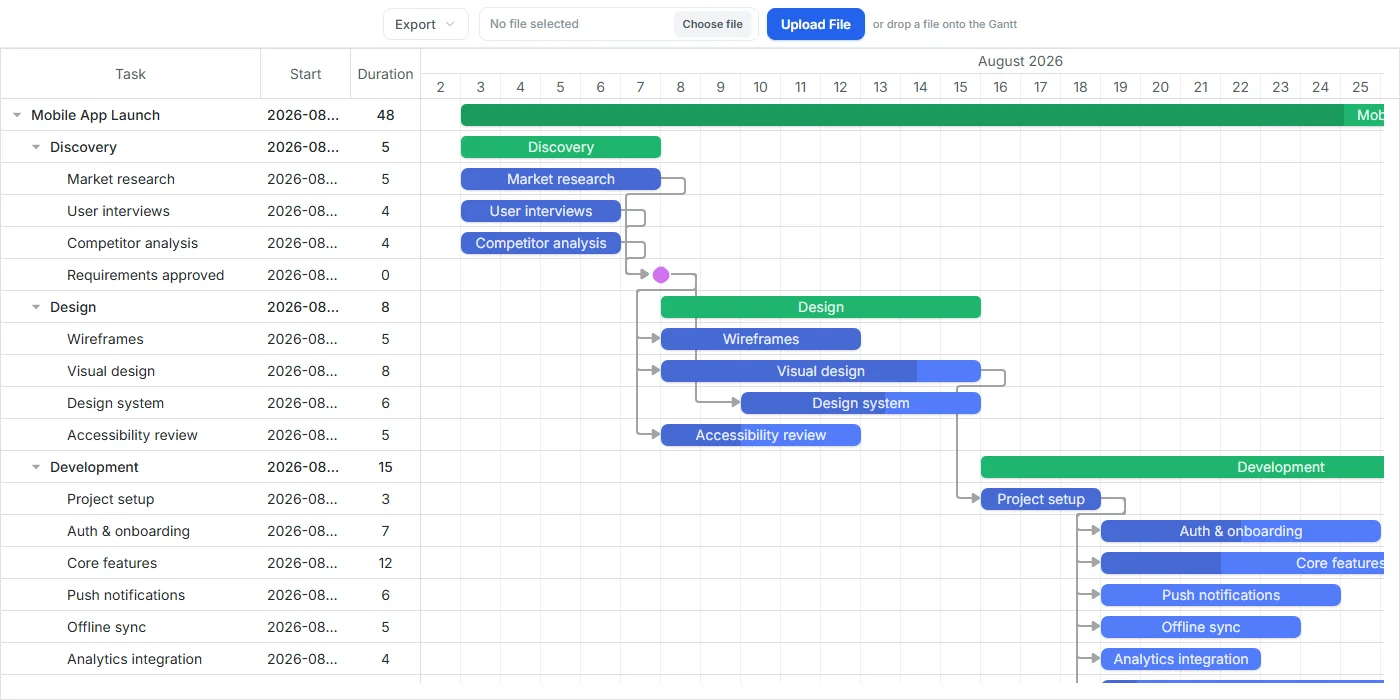
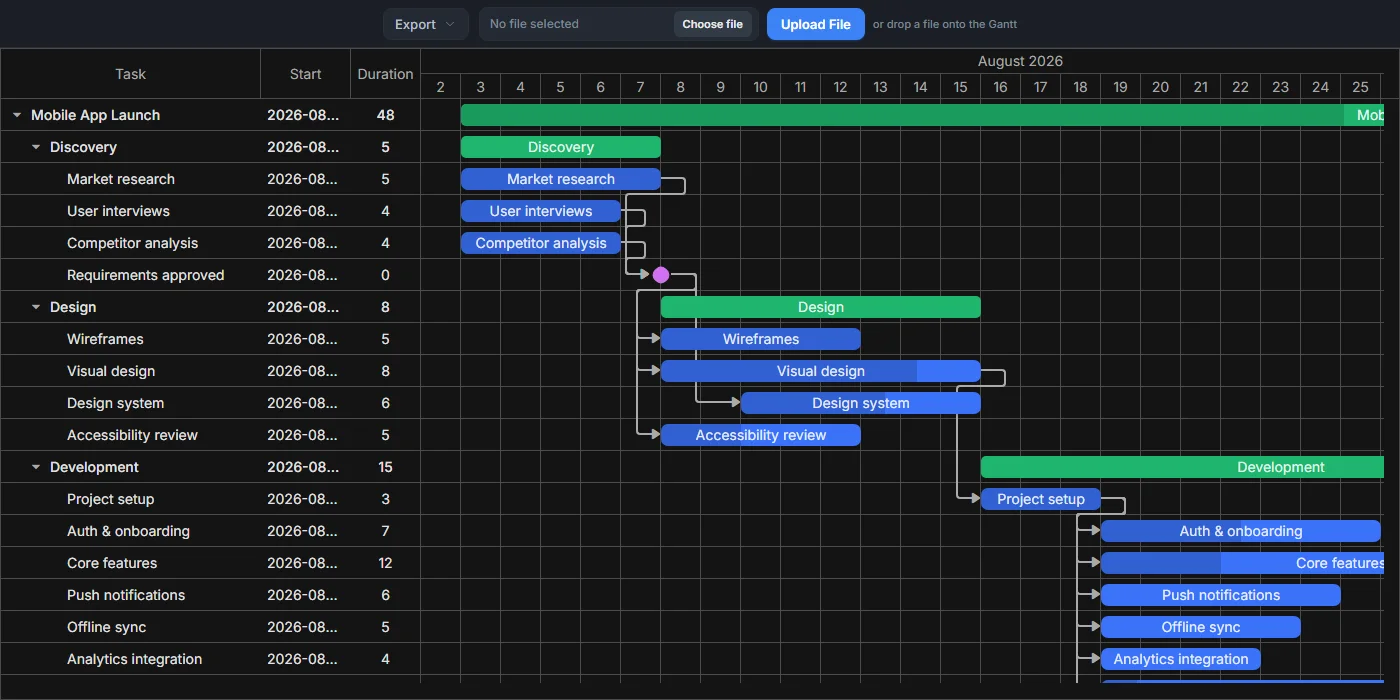
Export and import hub
Export the chart to PDF, PNG, iCal, Excel, MS Project, or Primavera P6, and import a project back from an uploaded MS Project or Primavera file.
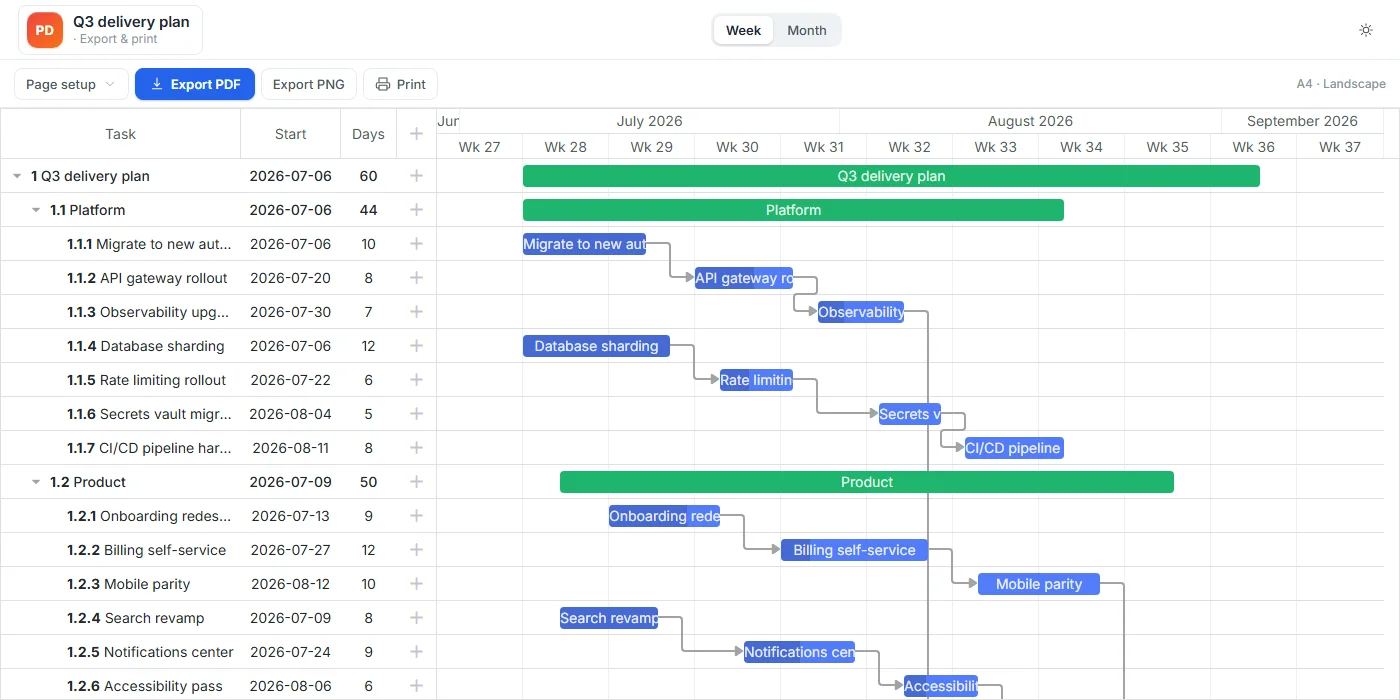
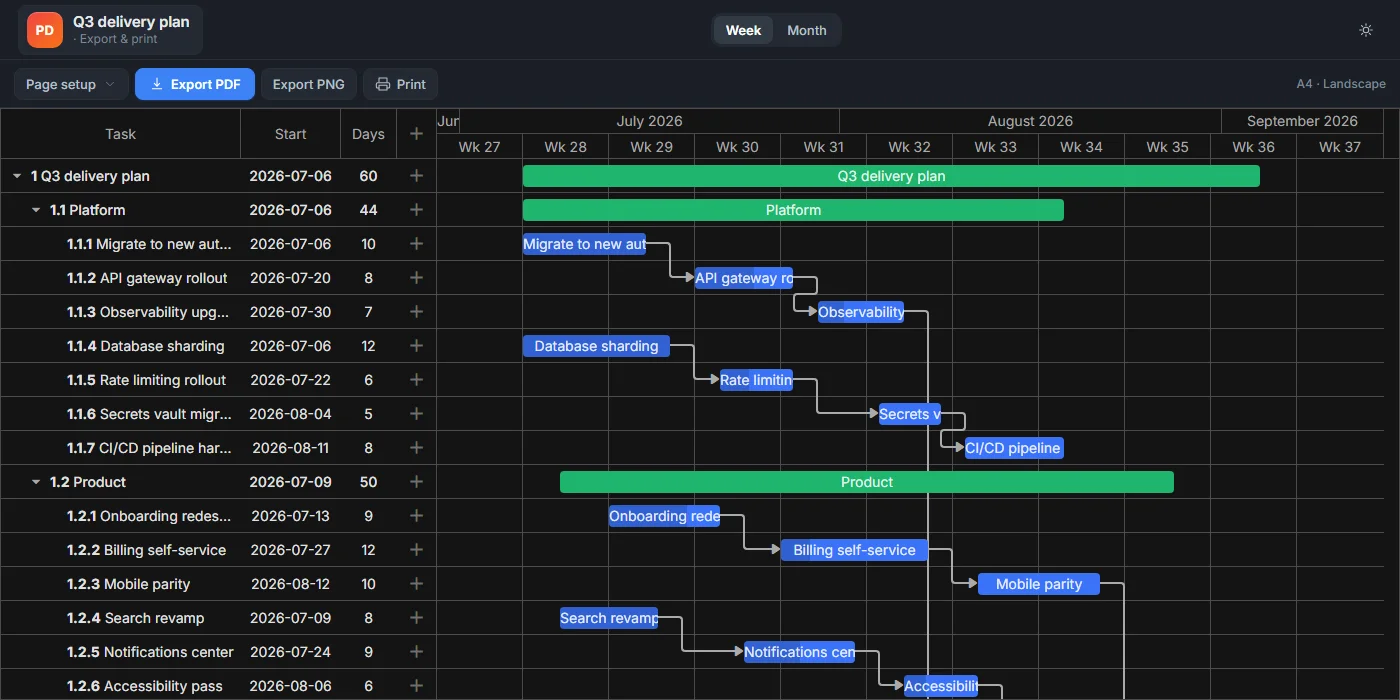
Export to PDF, PNG, and print
Export the live chart to PDF or PNG through a page-setup panel, or print it with a stylesheet that hides the demo chrome and renders every row.
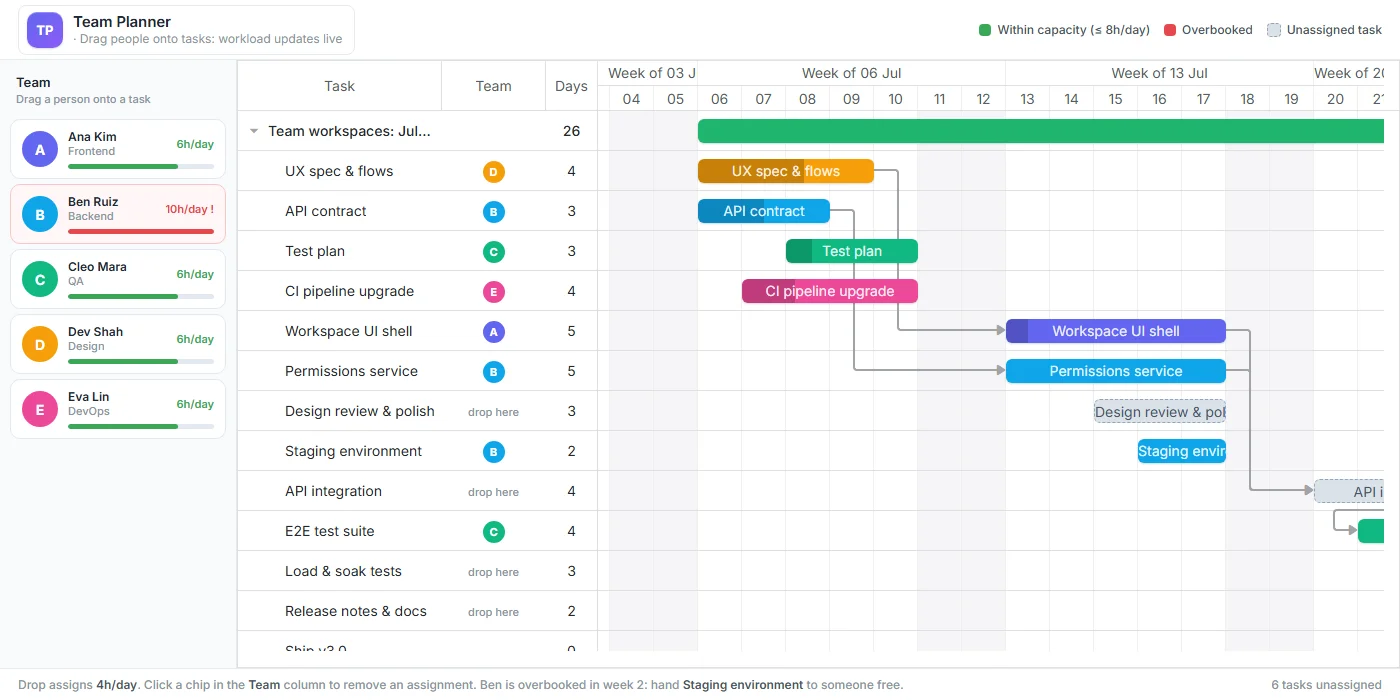
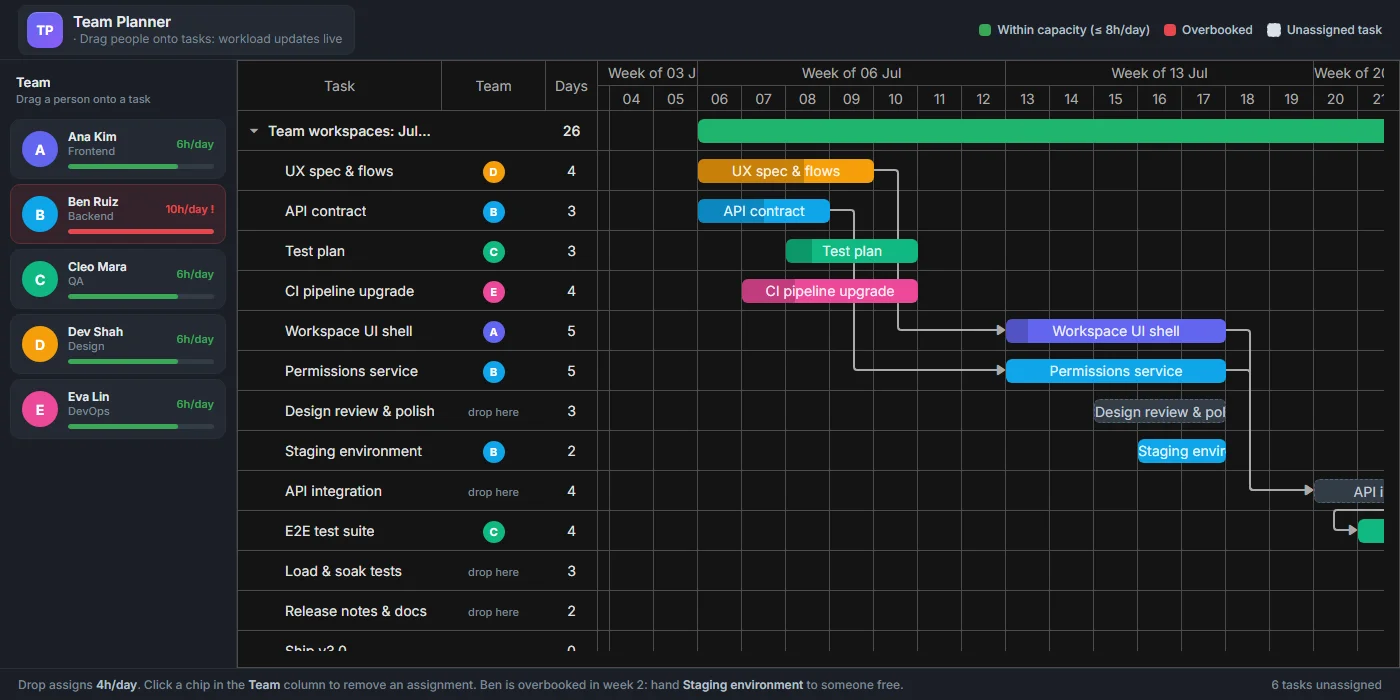
Team planner
Drag people from a workload panel onto tasks, and watch a card turn red the moment that person is overbooked.
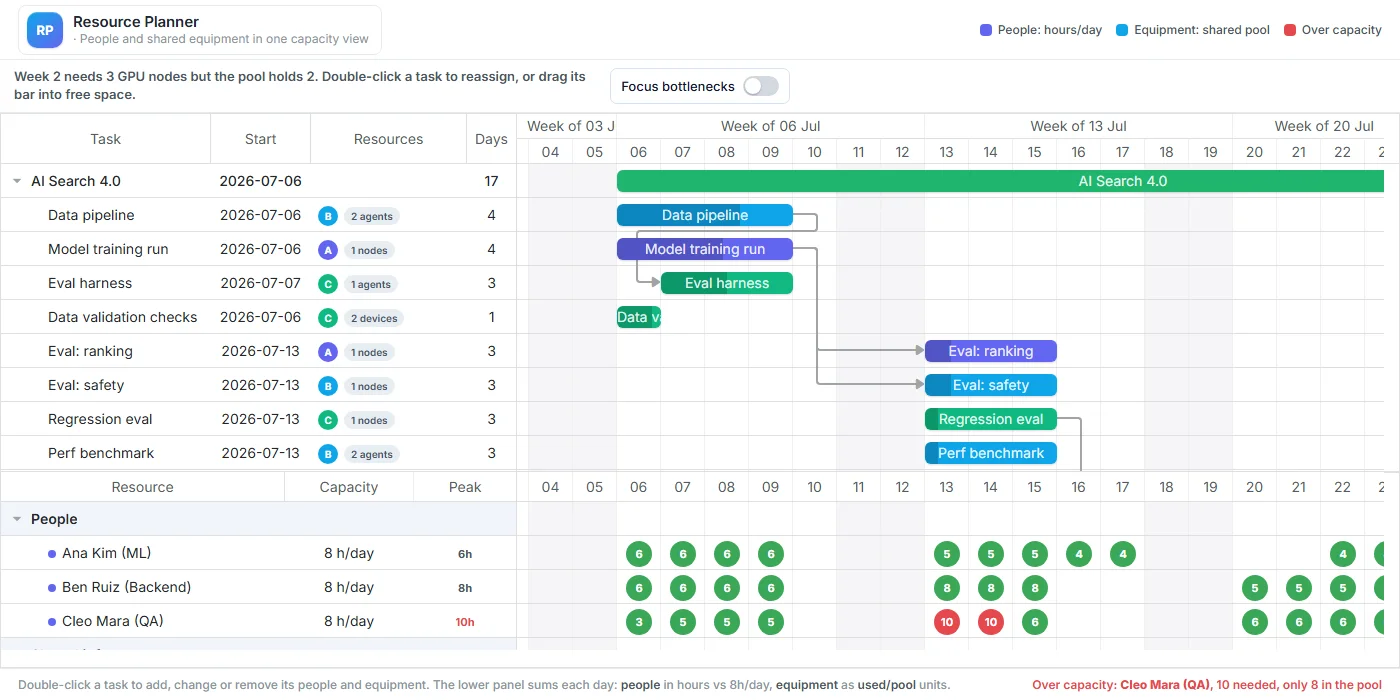
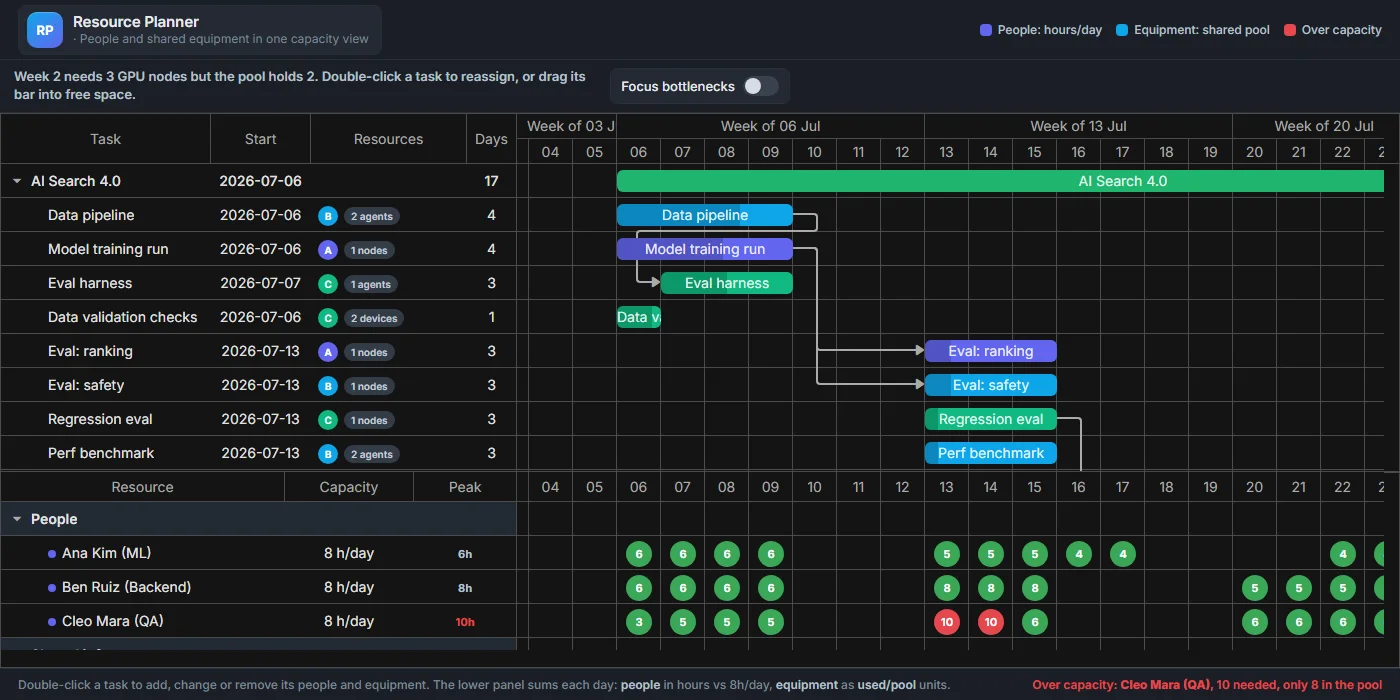
Work and material resources
Track people and shared equipment on one capacity panel, where a day cell turns red once demand passes the limit.
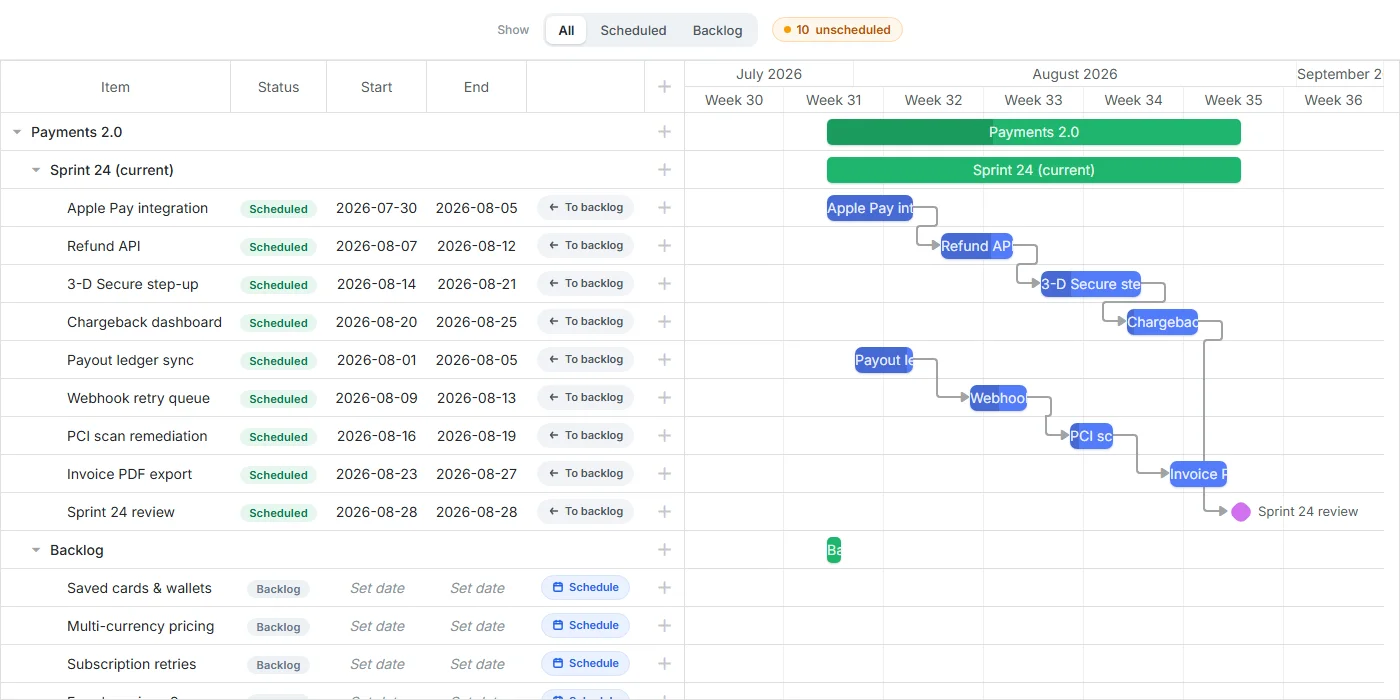
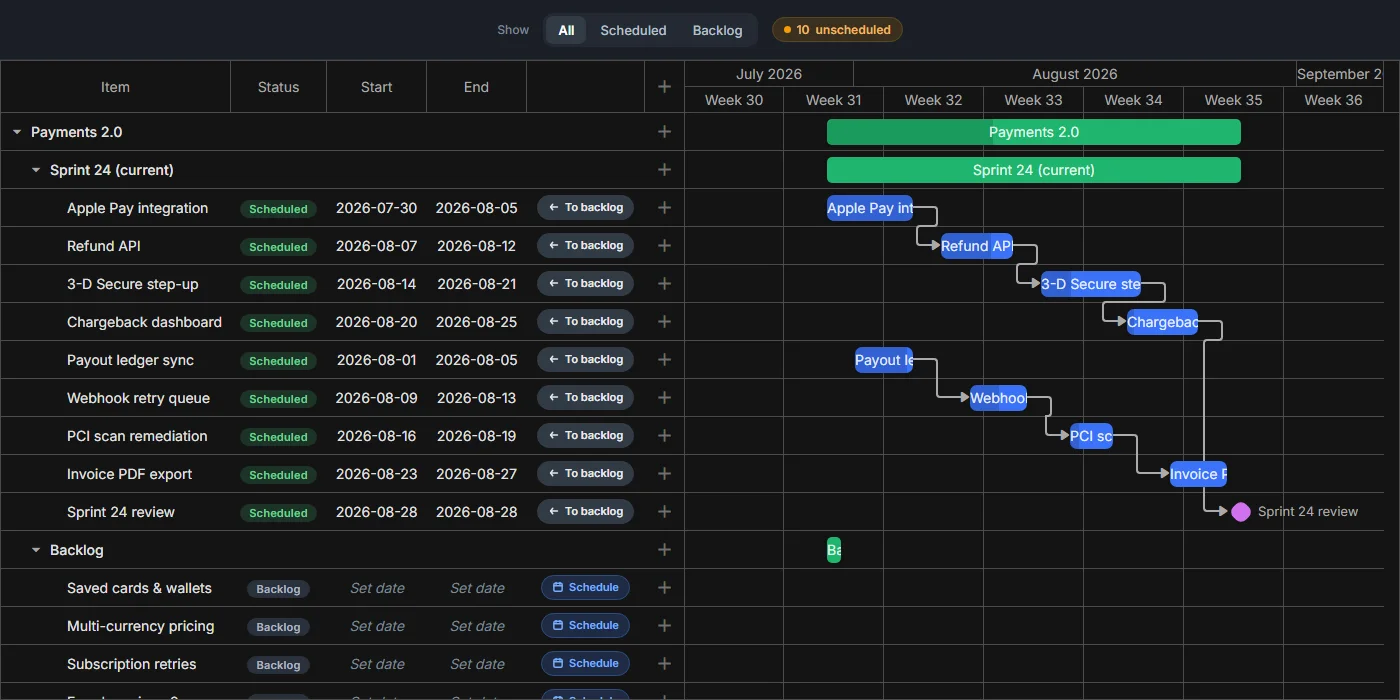
Unscheduled tasks
Move a task between a backlog and the schedule in one click, edit its dates right in the grid, or drag its row between the Sprint and Backlog groups.
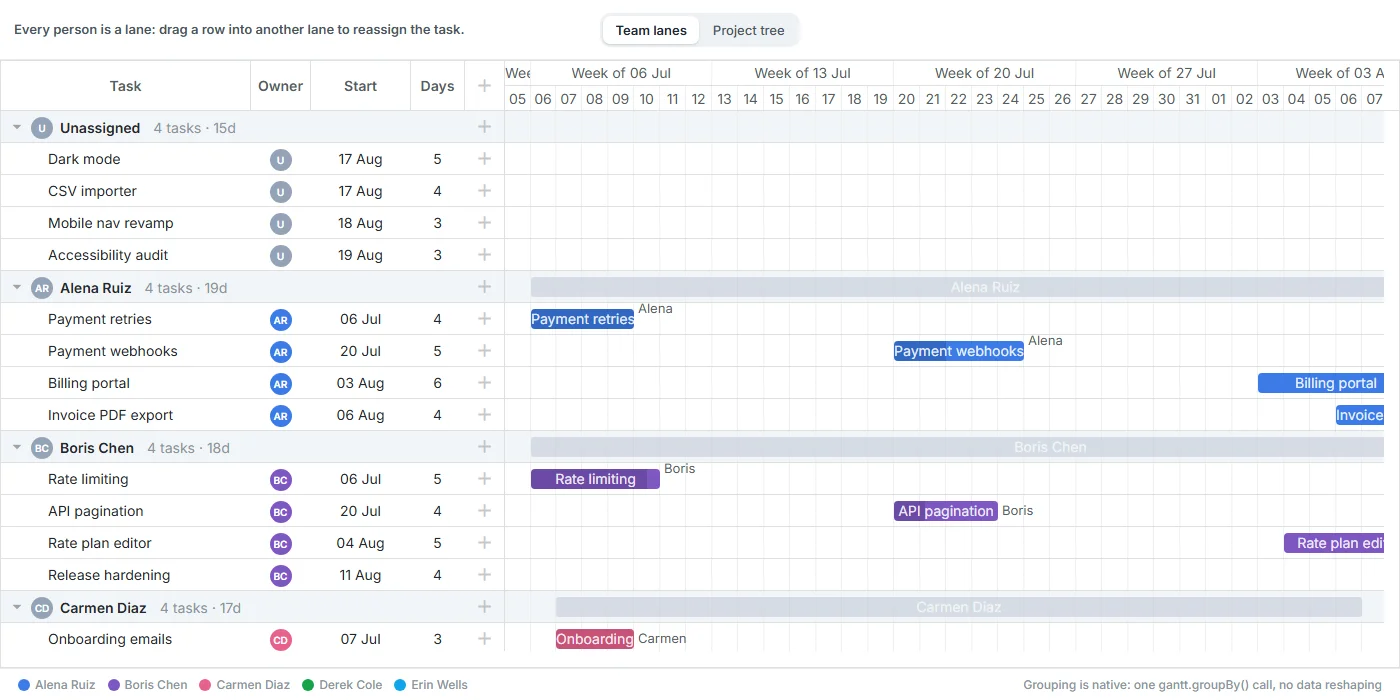
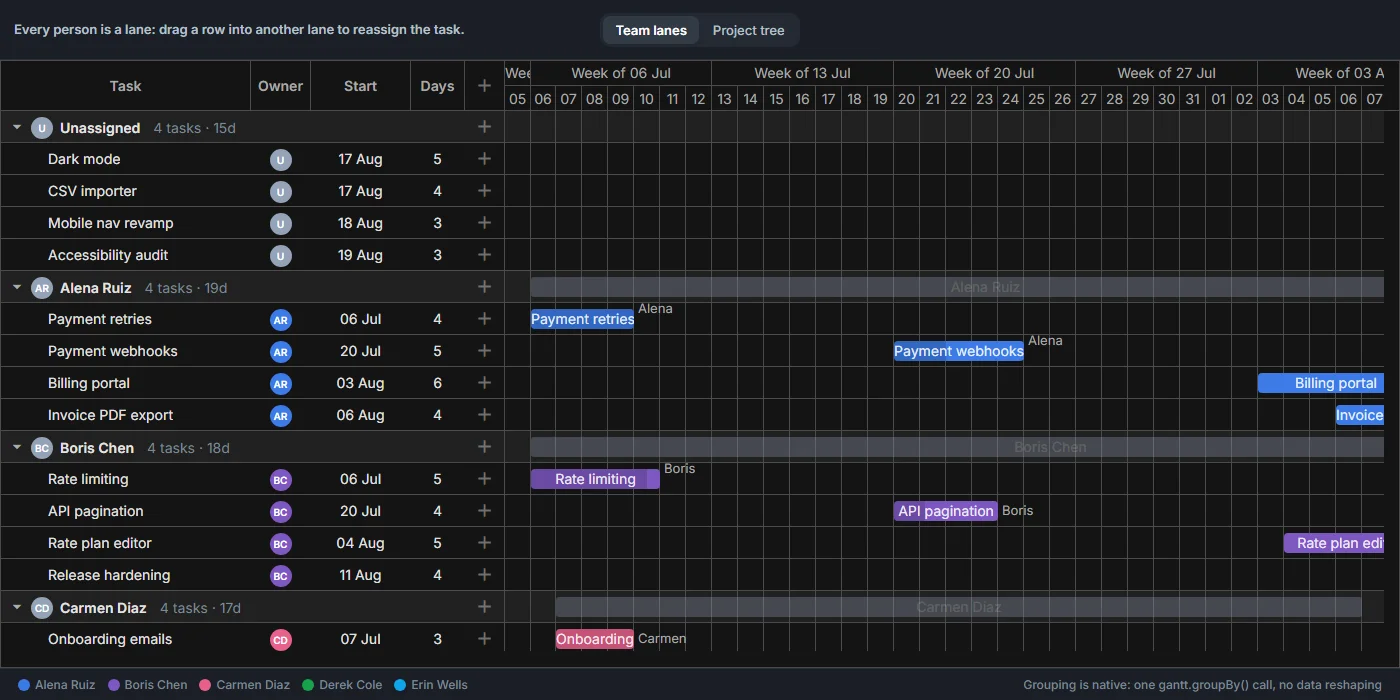
Resource swimlanes
Split the same task list into a lane per person, and drag a row into another lane to change its owner.
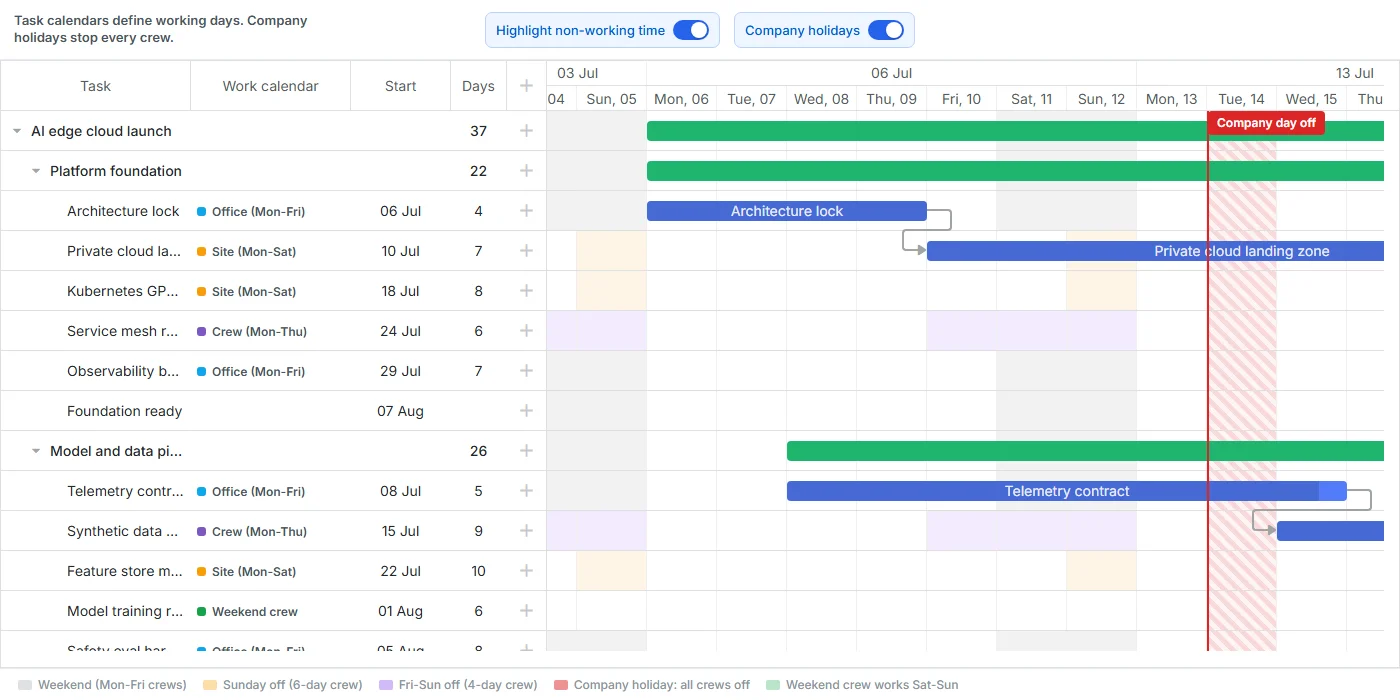
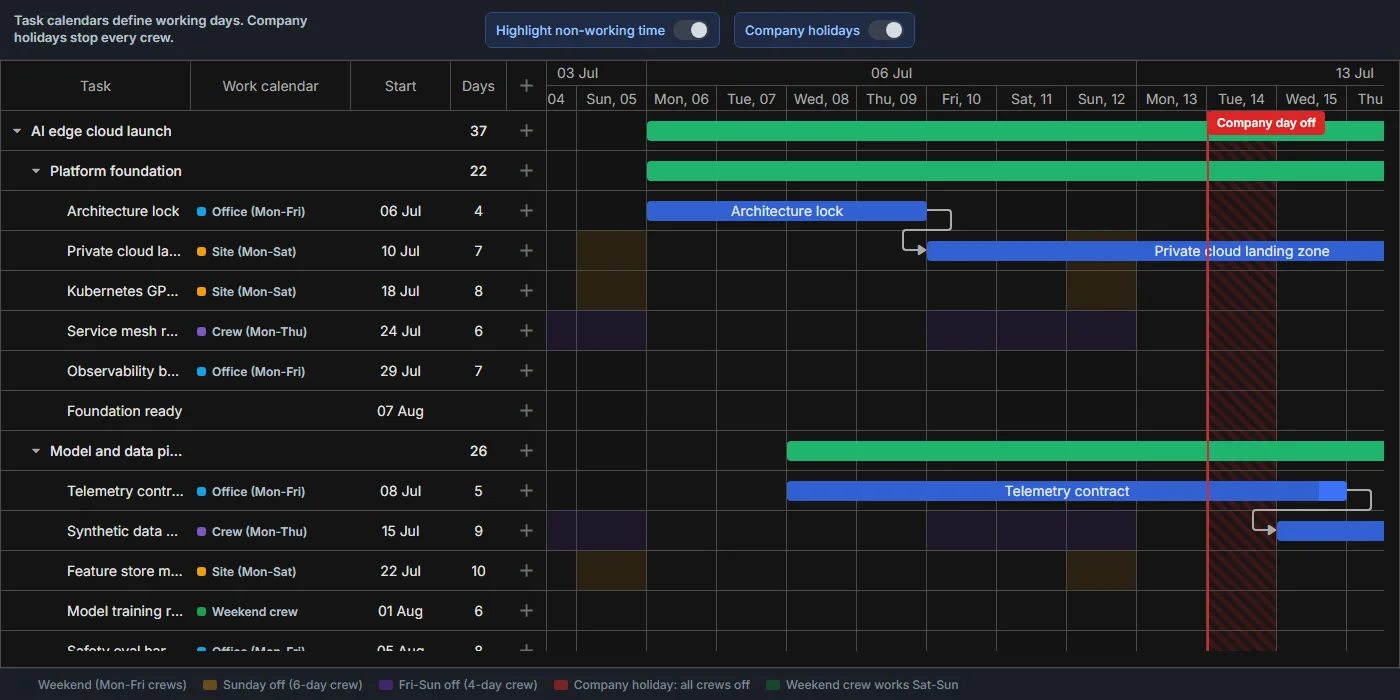
Work calendars and holidays
Give each crew its own working week, shade every row by its own calendar, and stop all of them with one holiday.
Context menu
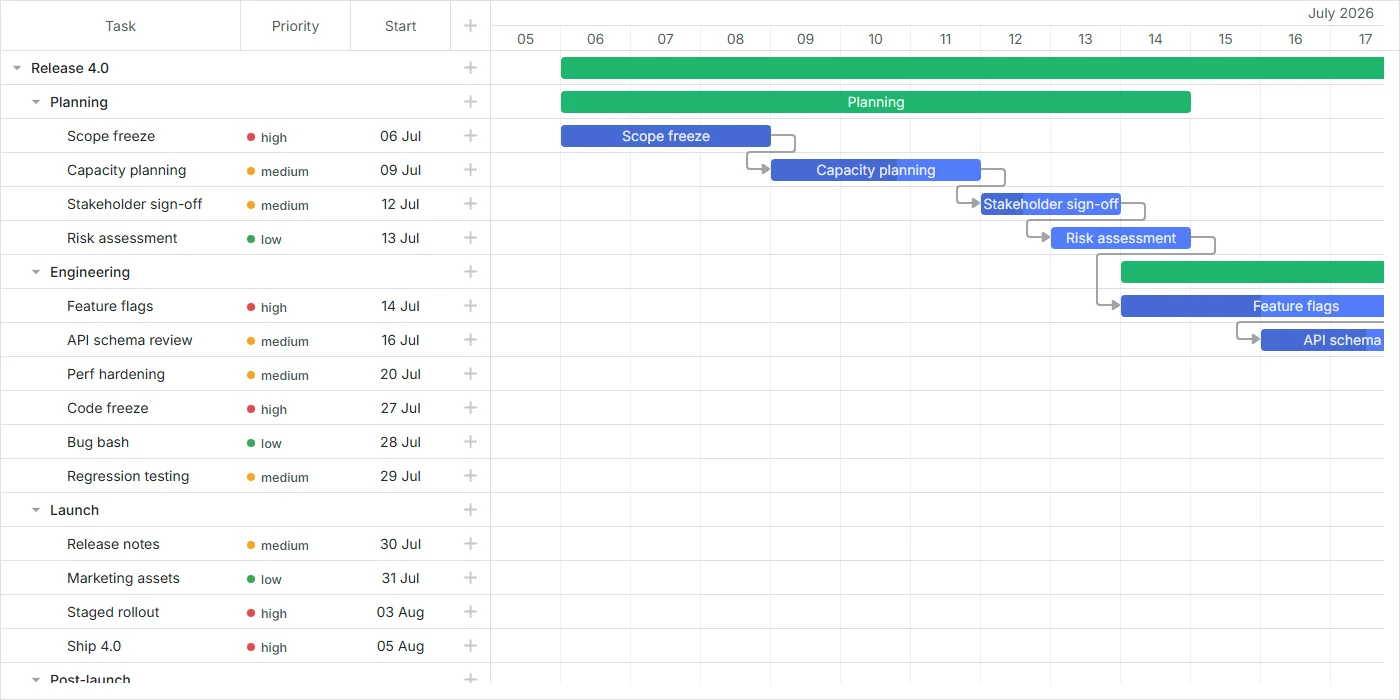
Open a custom right-click menu on a task to add a subtask, duplicate, indent or outdent, convert to a milestone, or delete it.
Task styling
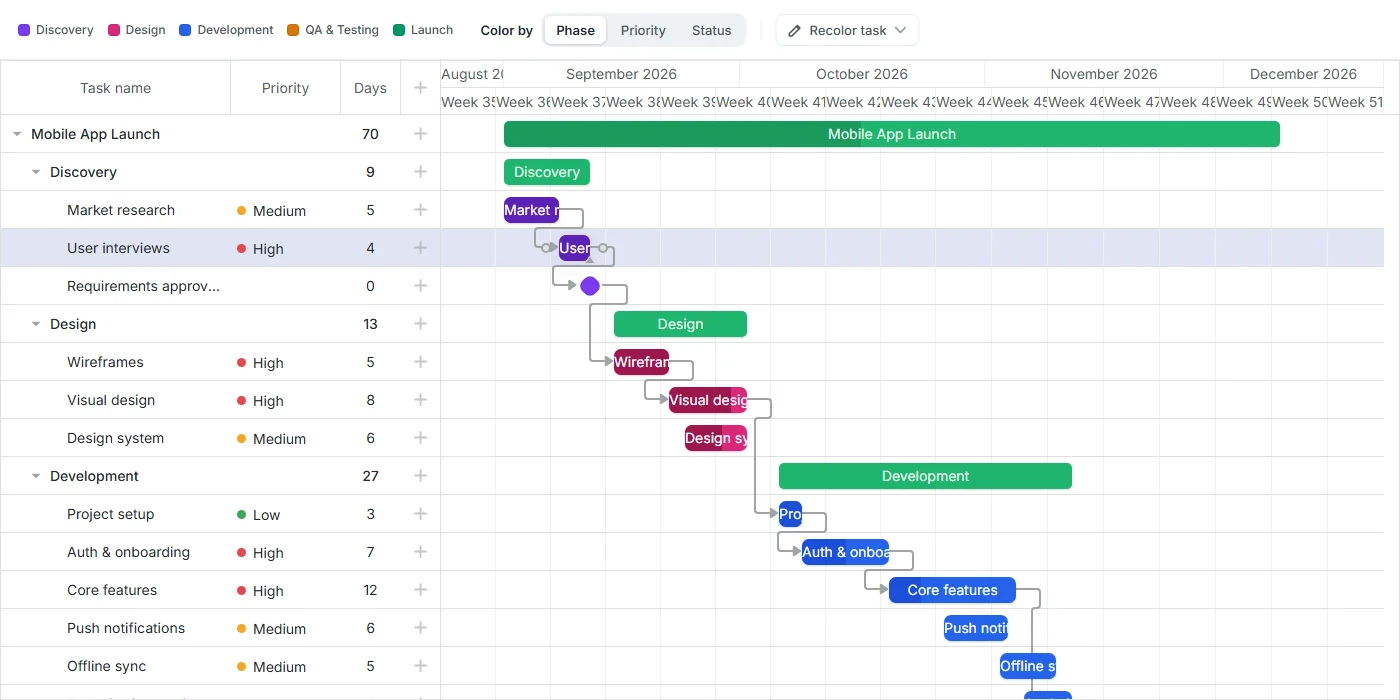
Compute each bar's color, progress color, and text color straight from data fields, with a manual override still available per task.
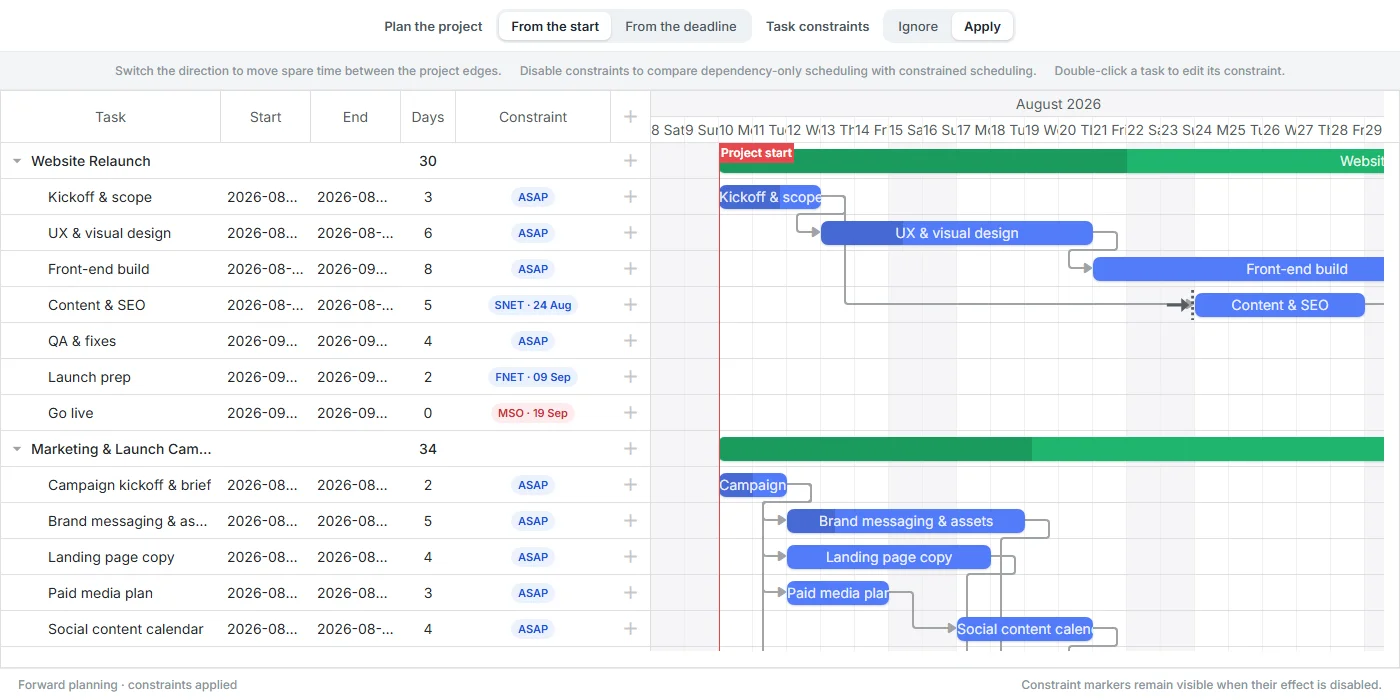
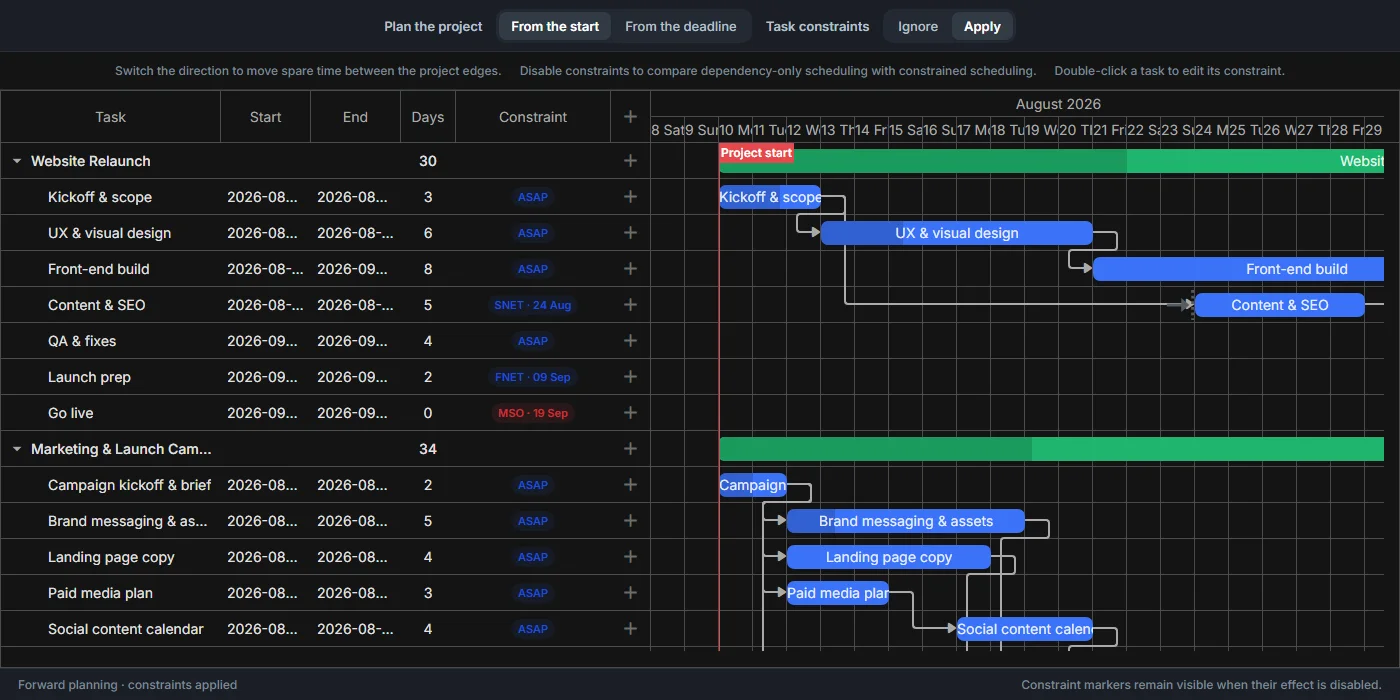
Schedule direction
Run auto scheduling from the start date or back from the deadline, and compare dependency only scheduling with task constraints.
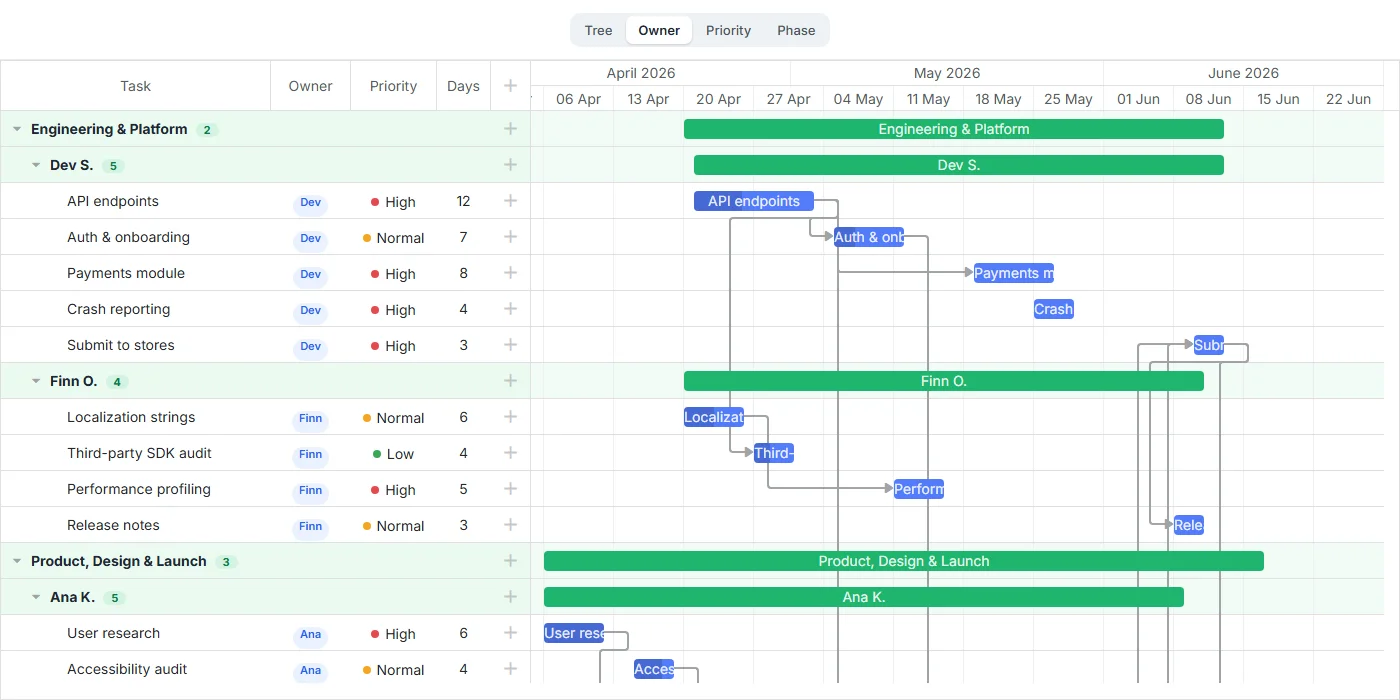
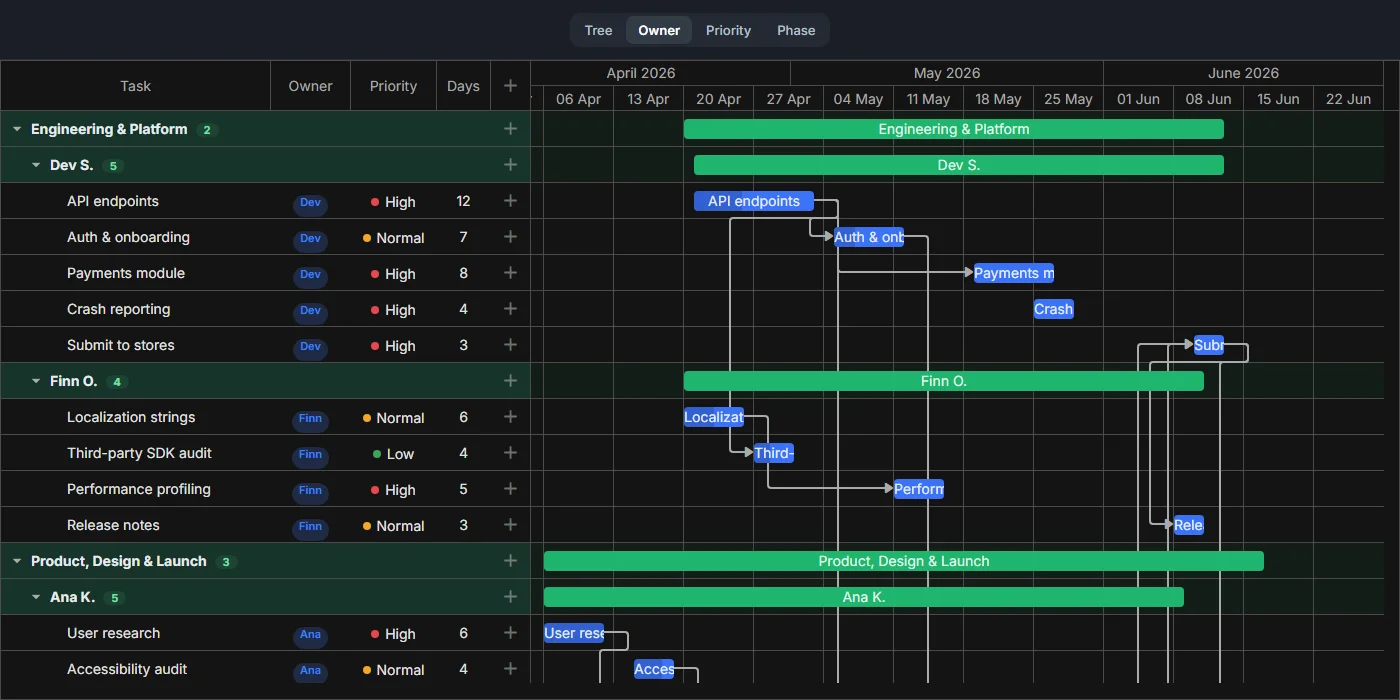
Task grouping
Re-bucket a flat task list under virtual group rows by owner, priority, or delivery phase, without changing the underlying data.
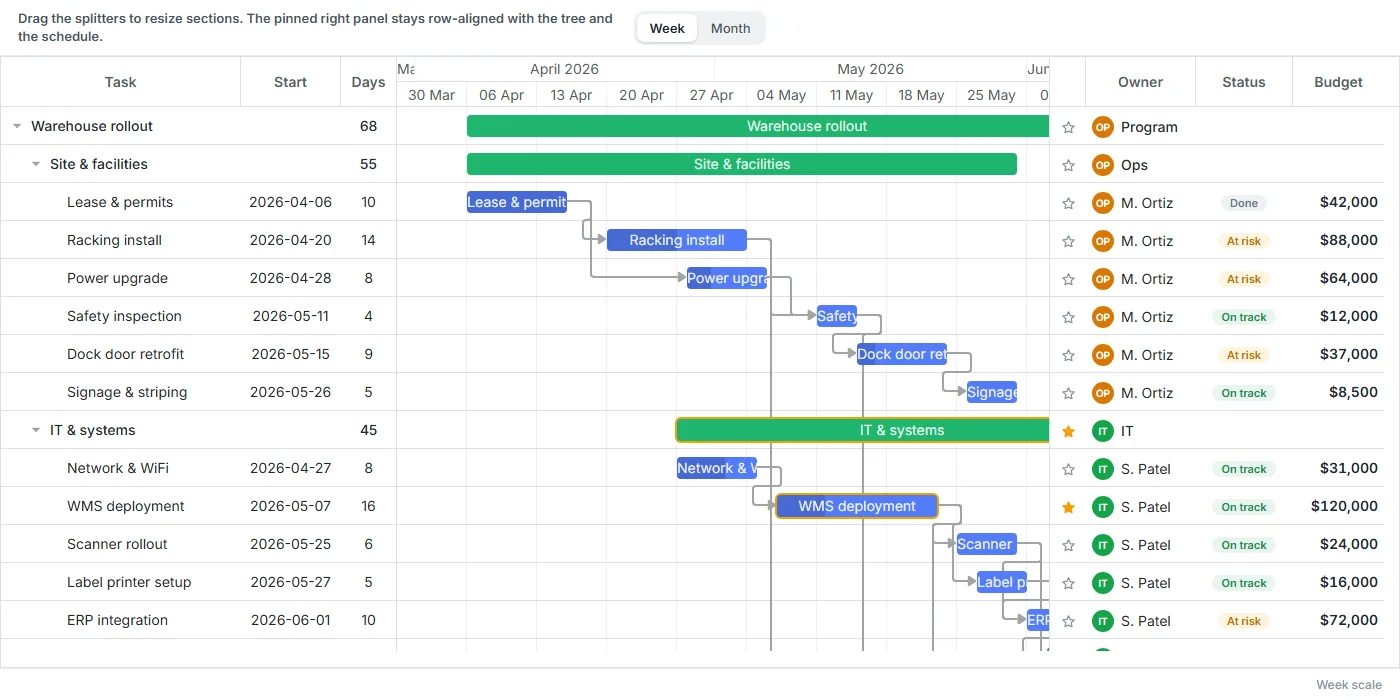
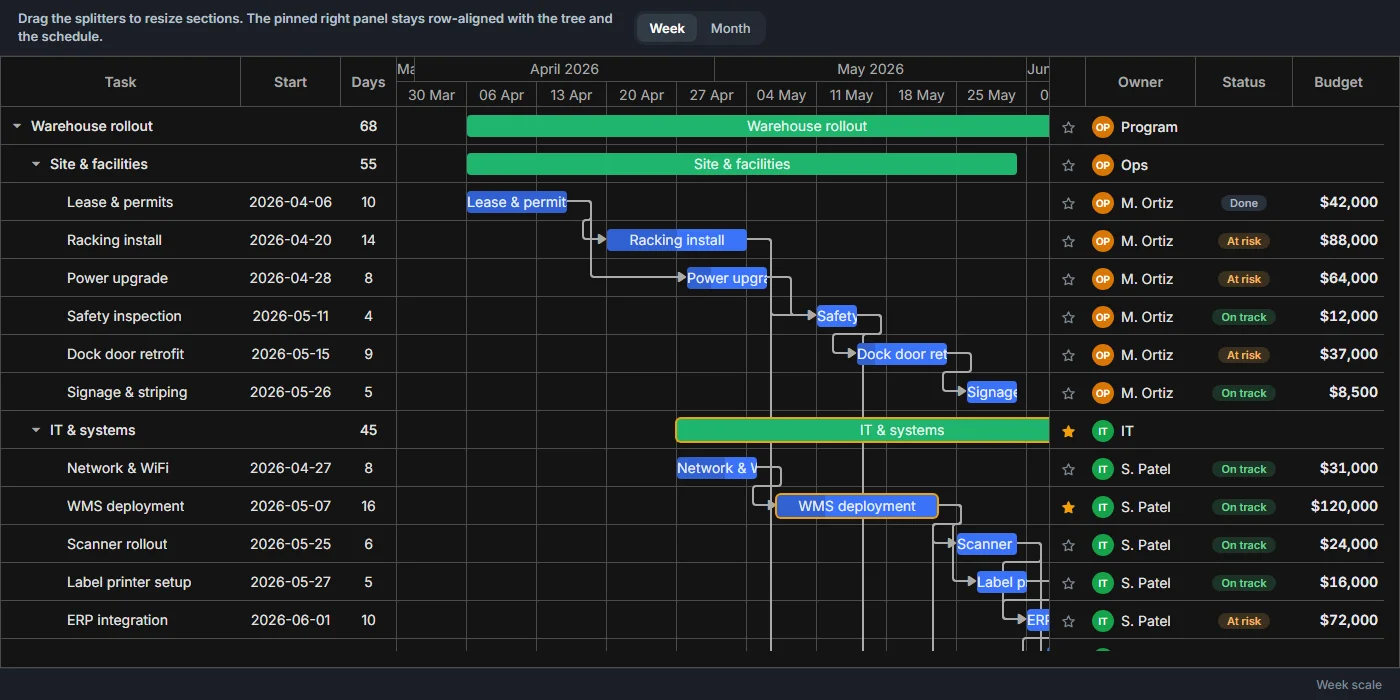
Grid sections
Split the chart into a task tree, the schedule, and a pinned KPI panel that share one scrollbar, with draggable splitters between the sections.
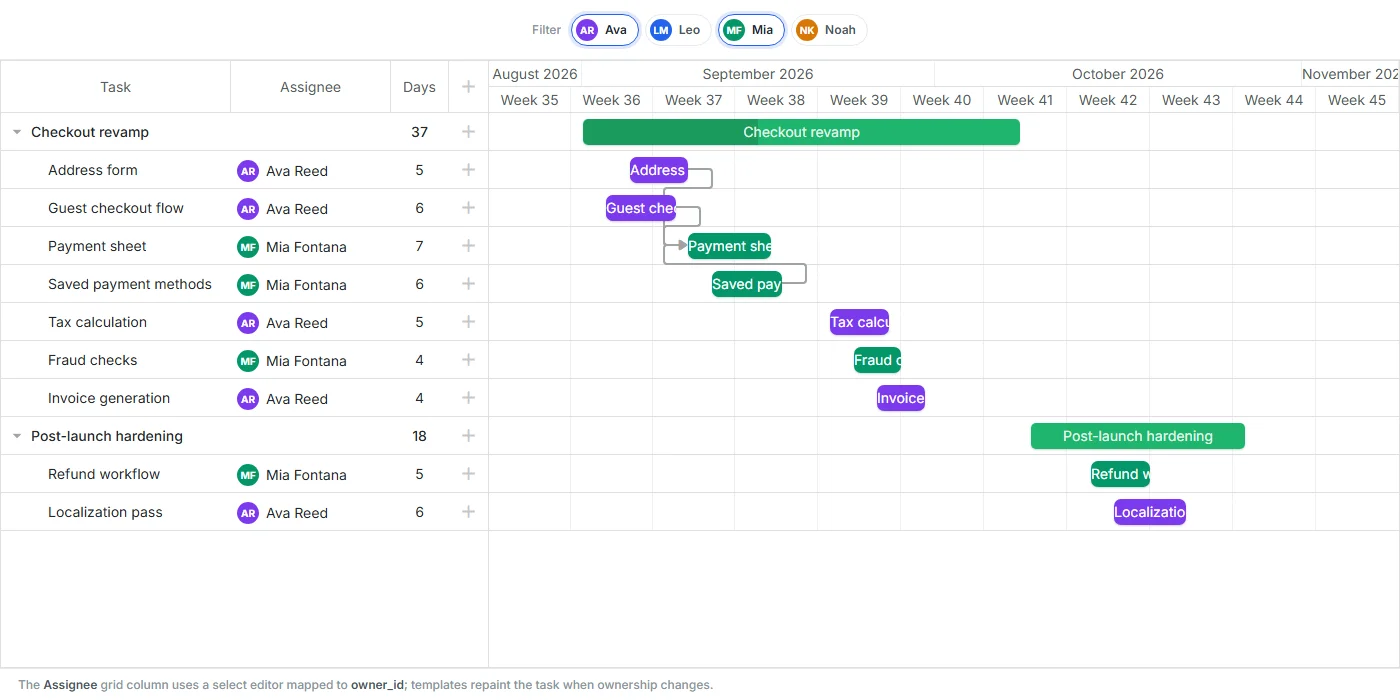
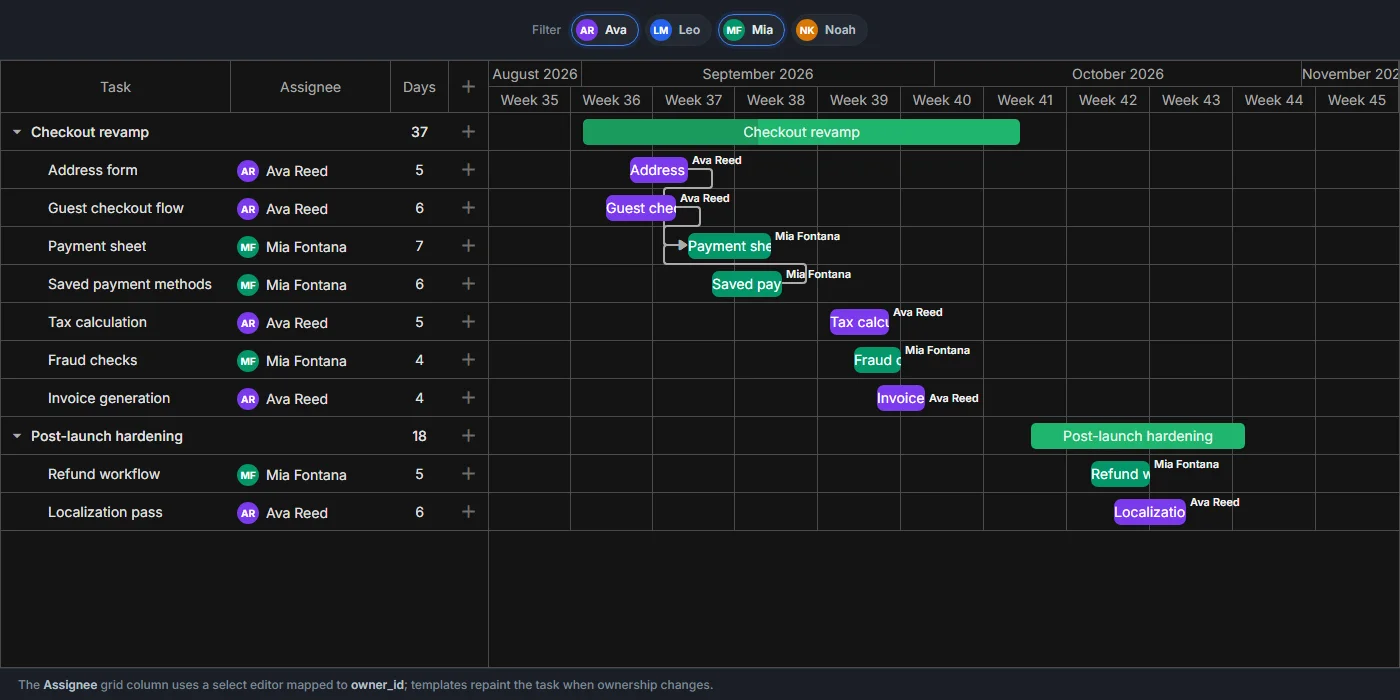
Single resource per task
Give each task one owner from a select editor, color bars by that owner, and filter the chart by clicking a person.
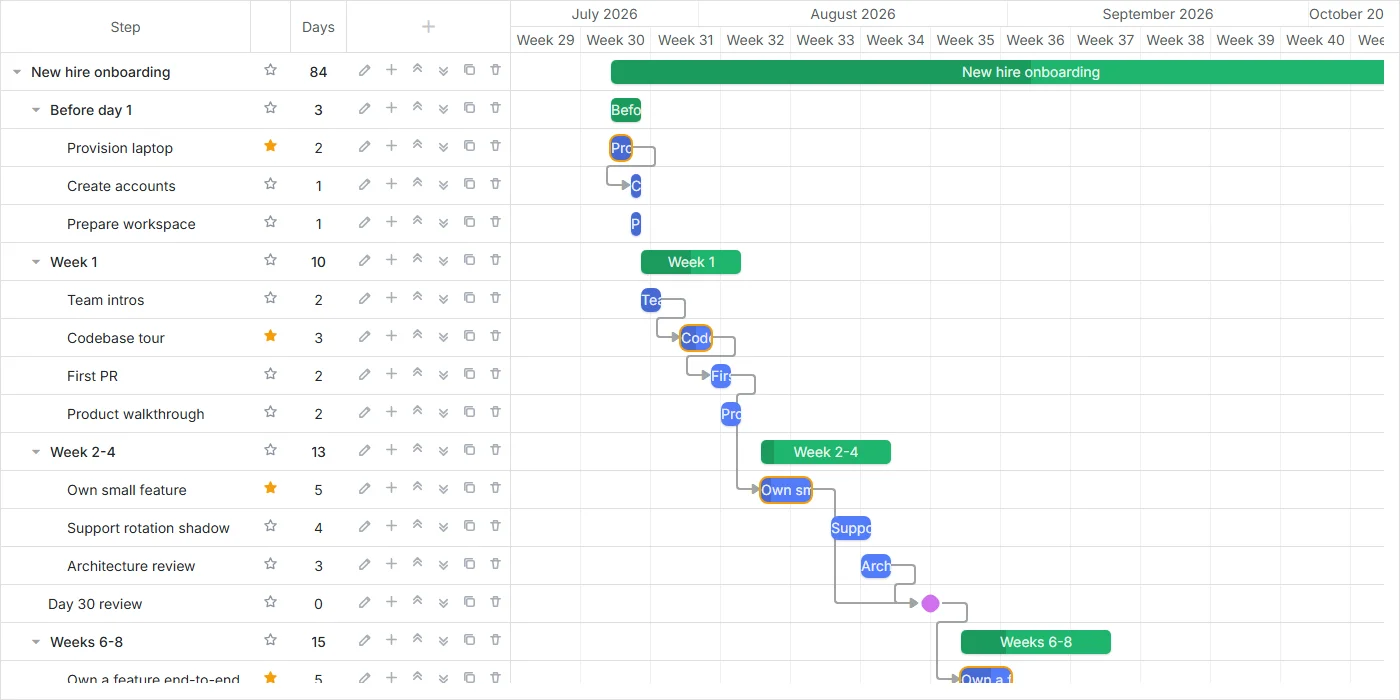
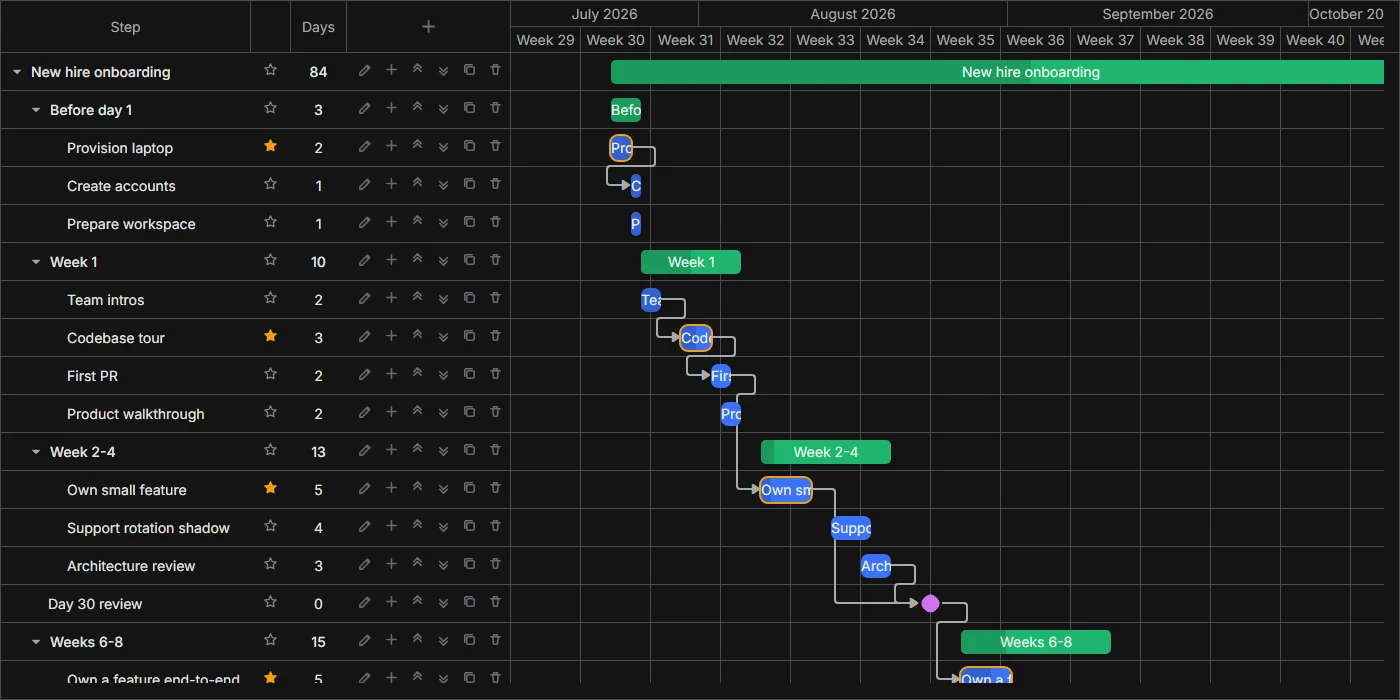
Grid controls
Render edit, add-child, duplicate, delete, and star-flag buttons in every grid row, each wired straight to the Gantt API.
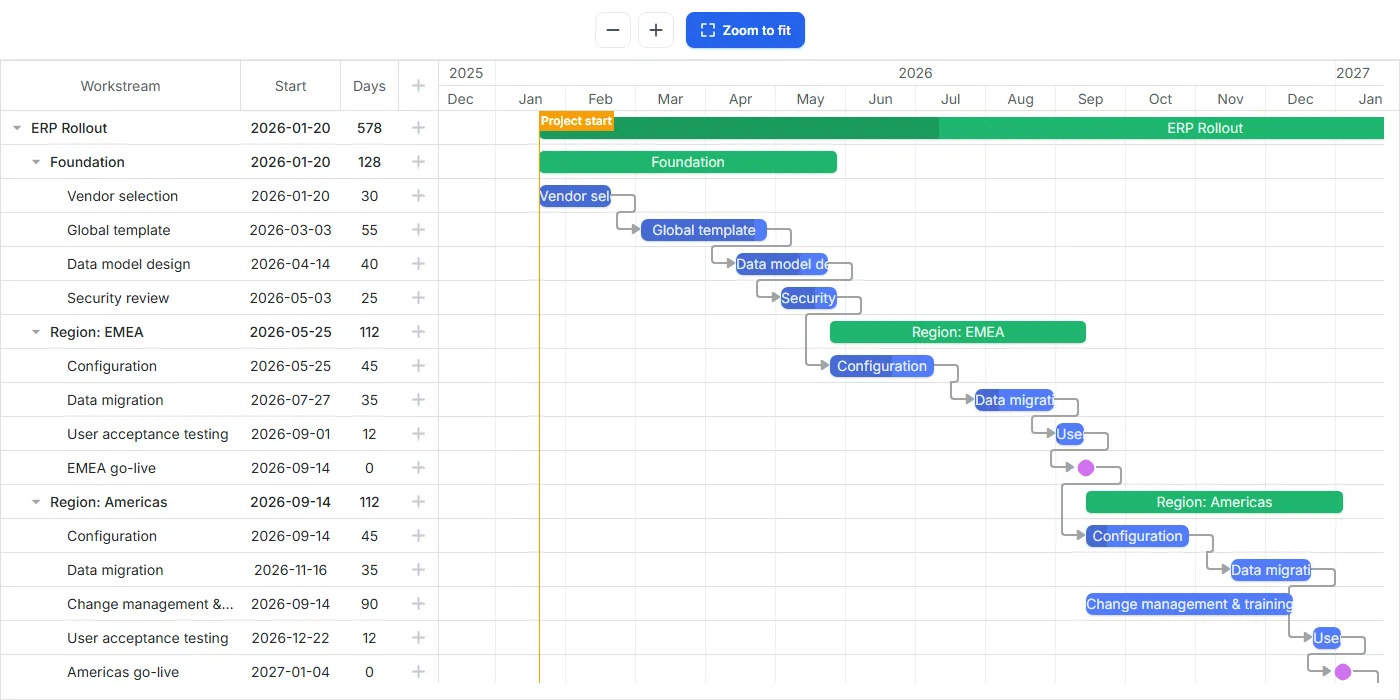
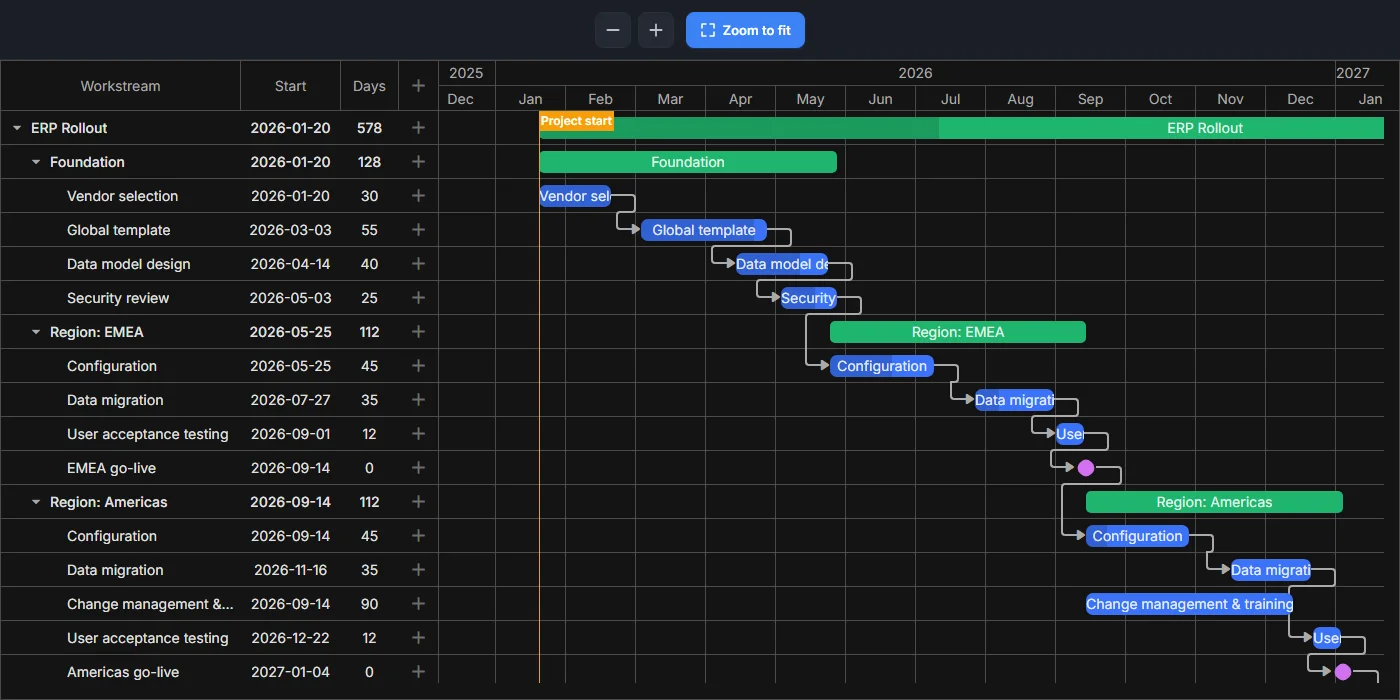
Zoom to fit
Step the zoom level in and out or zoom to fit the project's own start and end markers, on a timeline anchored to today's date.
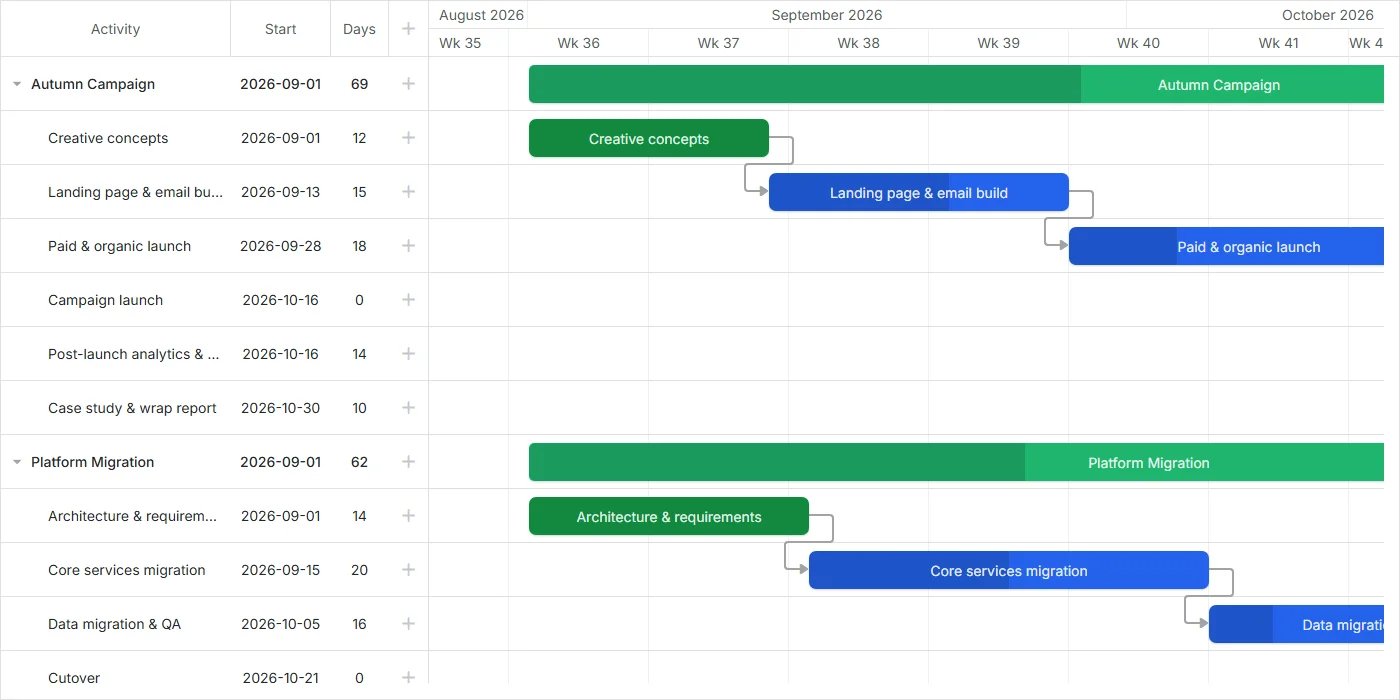
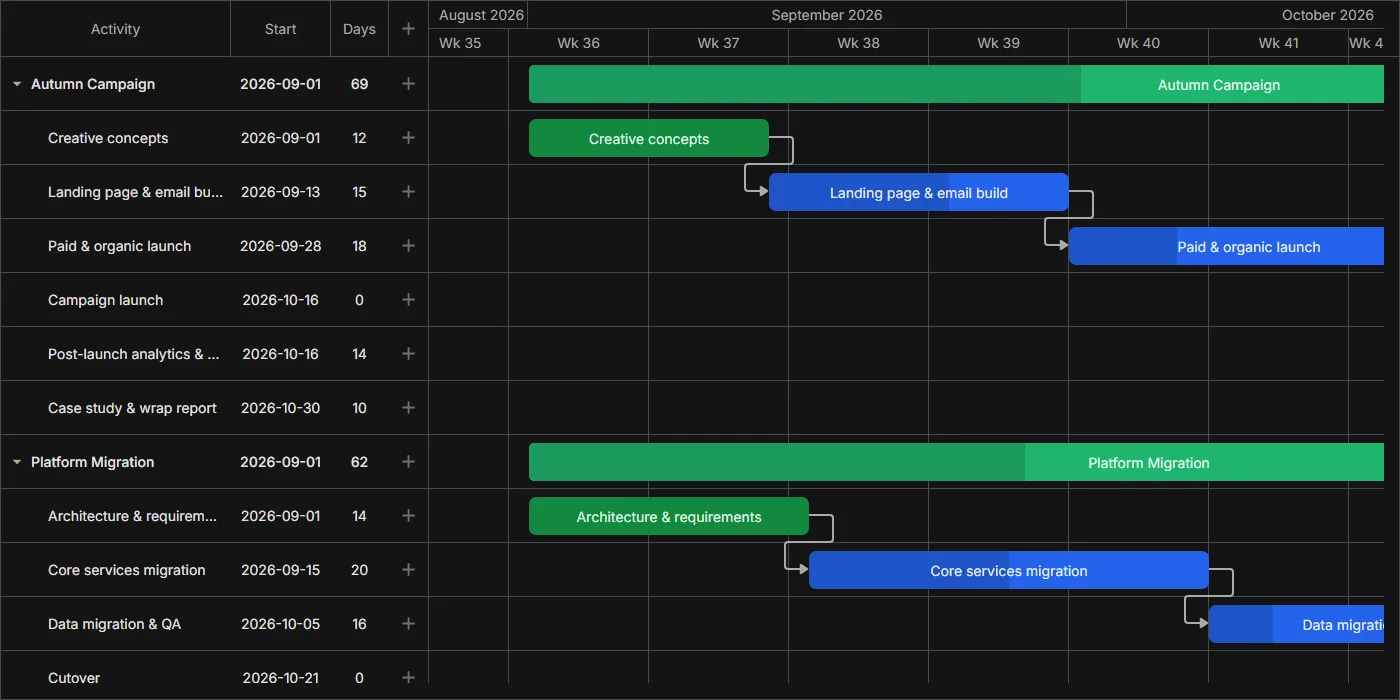
Custom tooltips
Render a designed tooltip card for task bars and add targeted tooltips for dependency links and date-scale cells.
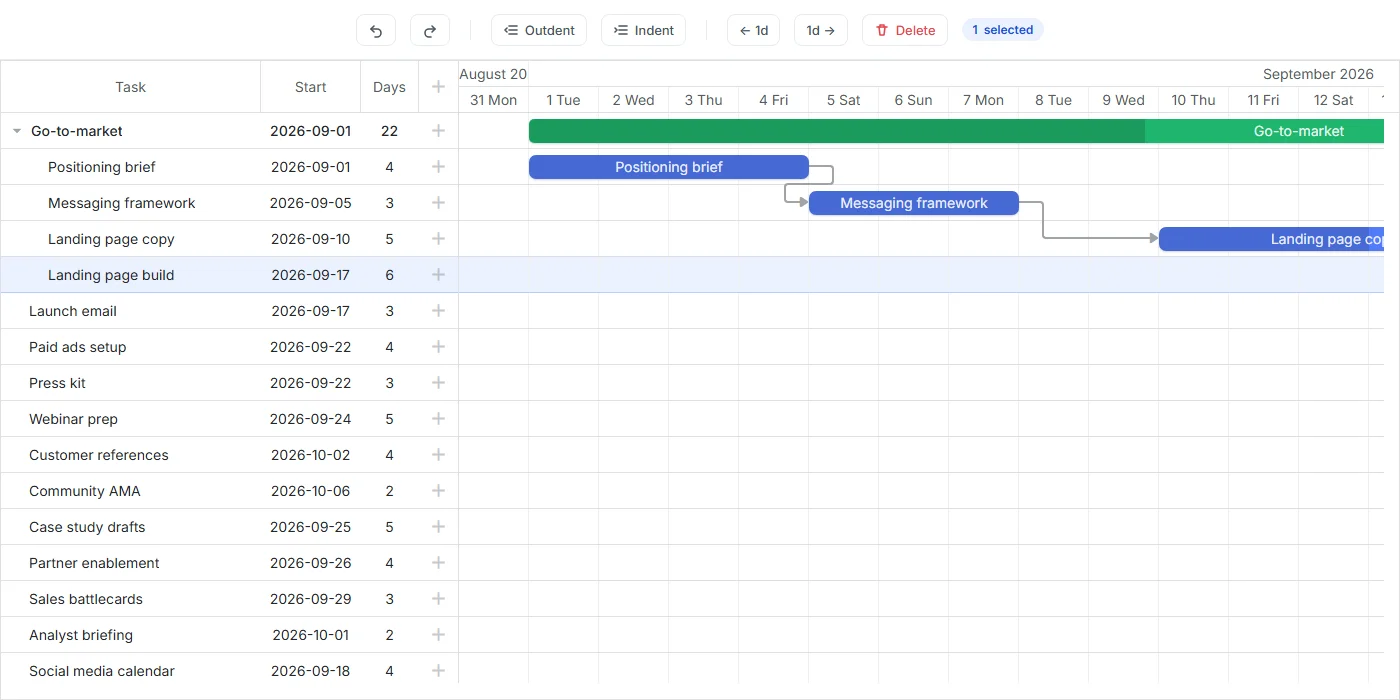
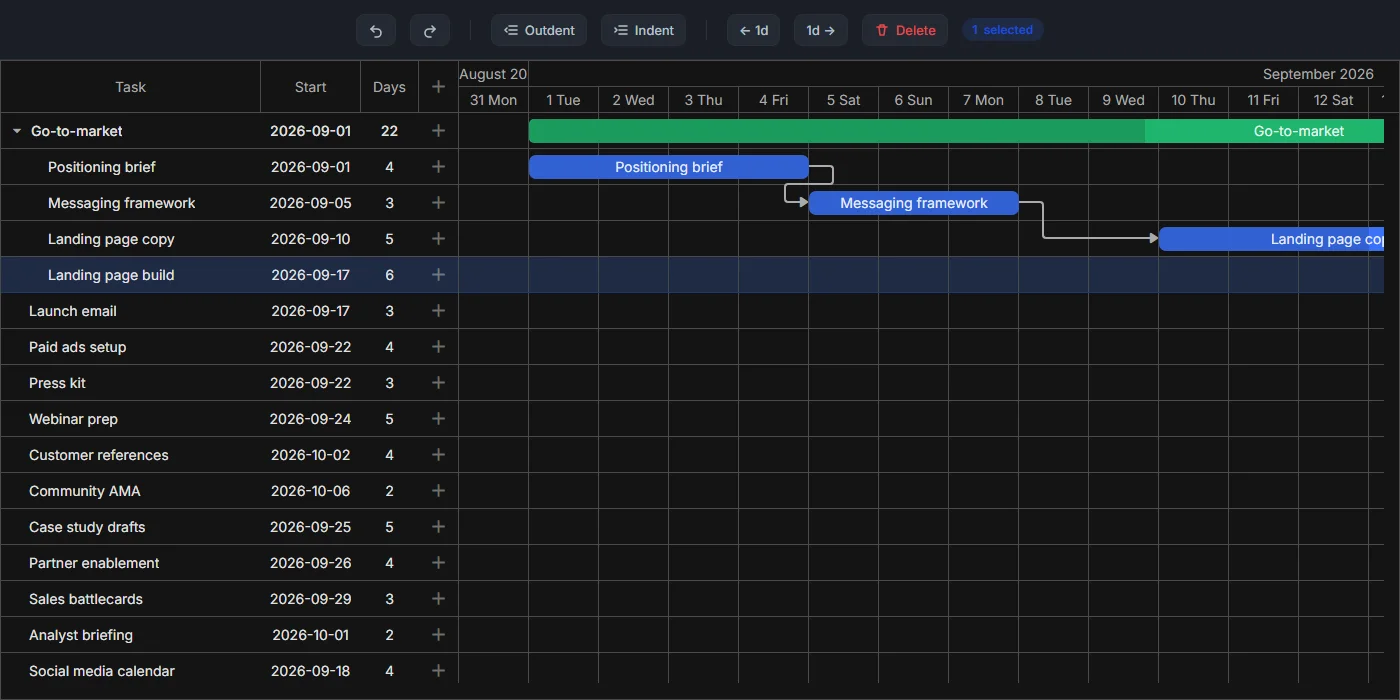
Multiselect and indent
Shift- or ctrl-select several rows, indent or outdent them together, and undo or redo the whole batch as one step.
Highlight position on drag
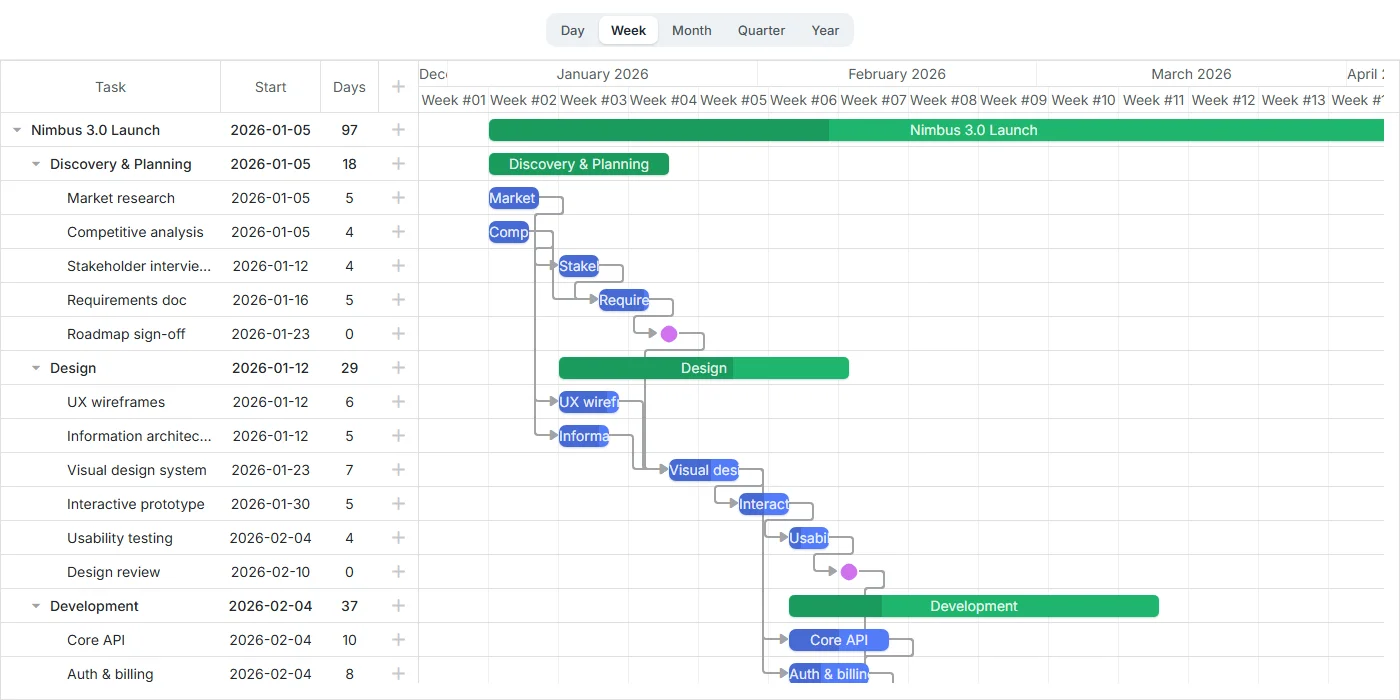
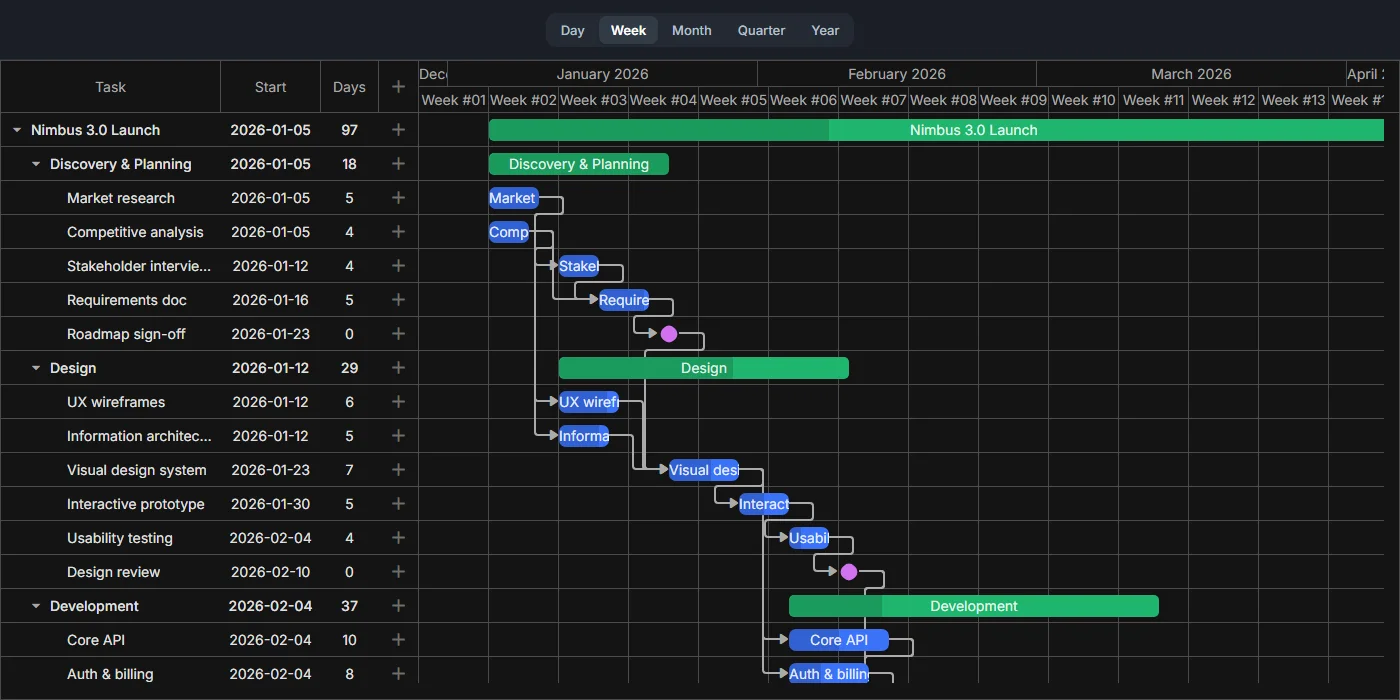
Show a crosshair and live start and end dates alongside a task bar while it's dragged, so you can see exactly where it will land.
Rollup vs preview
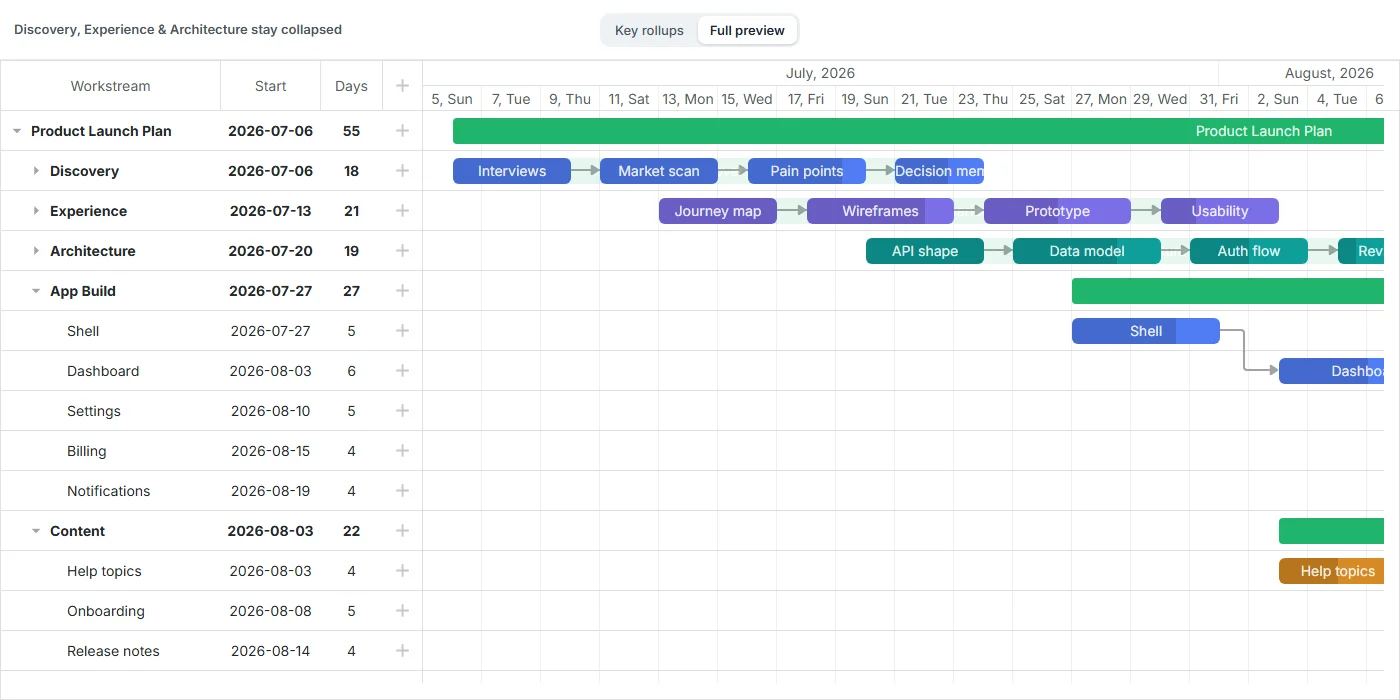
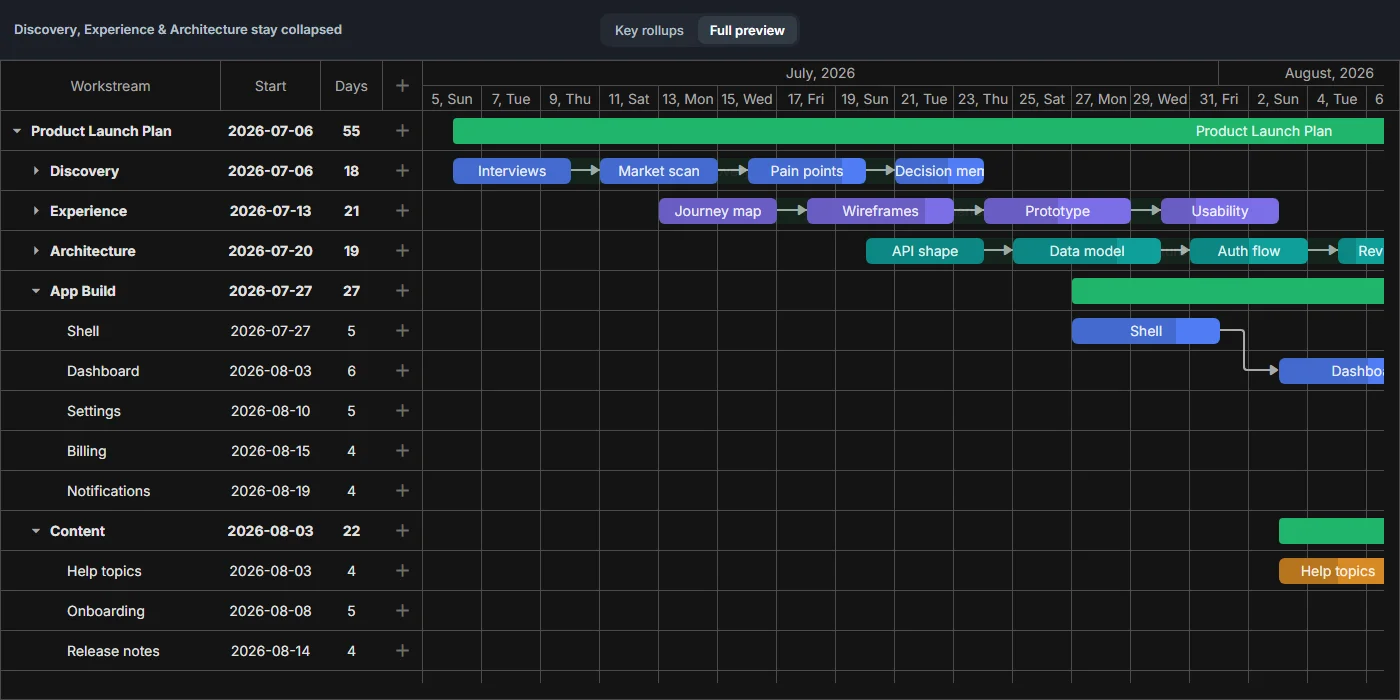
Compare native rollup markers on a collapsed workstream's summary bar against split rendering that previews every child task on the same row.
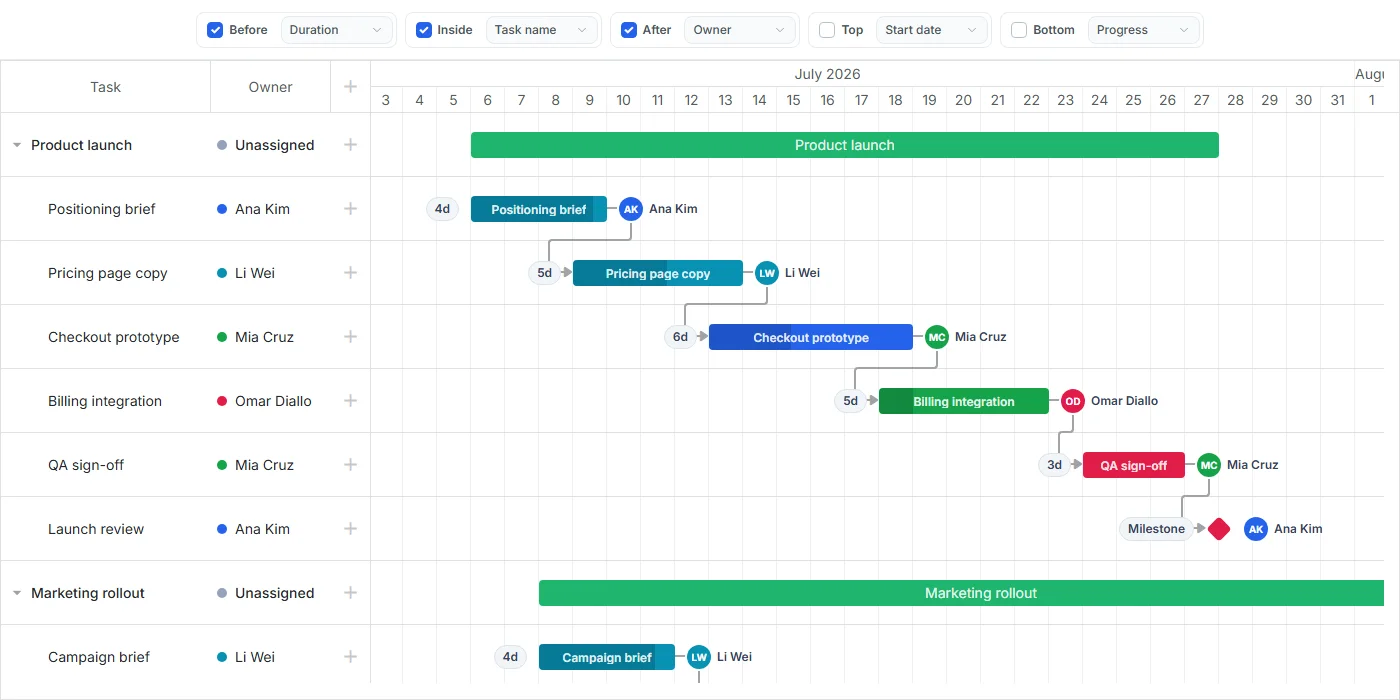
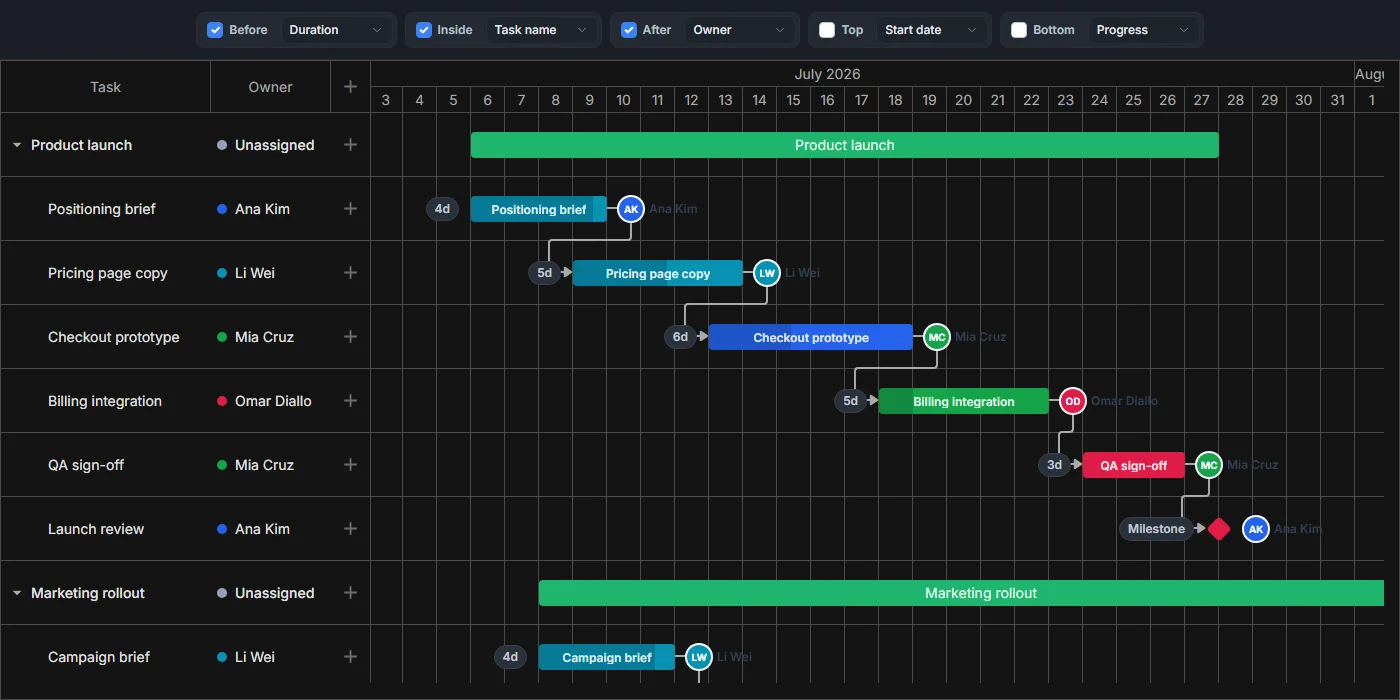
Task label position
Move task labels above, below, or inside the bar and choose what each label shows, such as the owner, risk, or title.
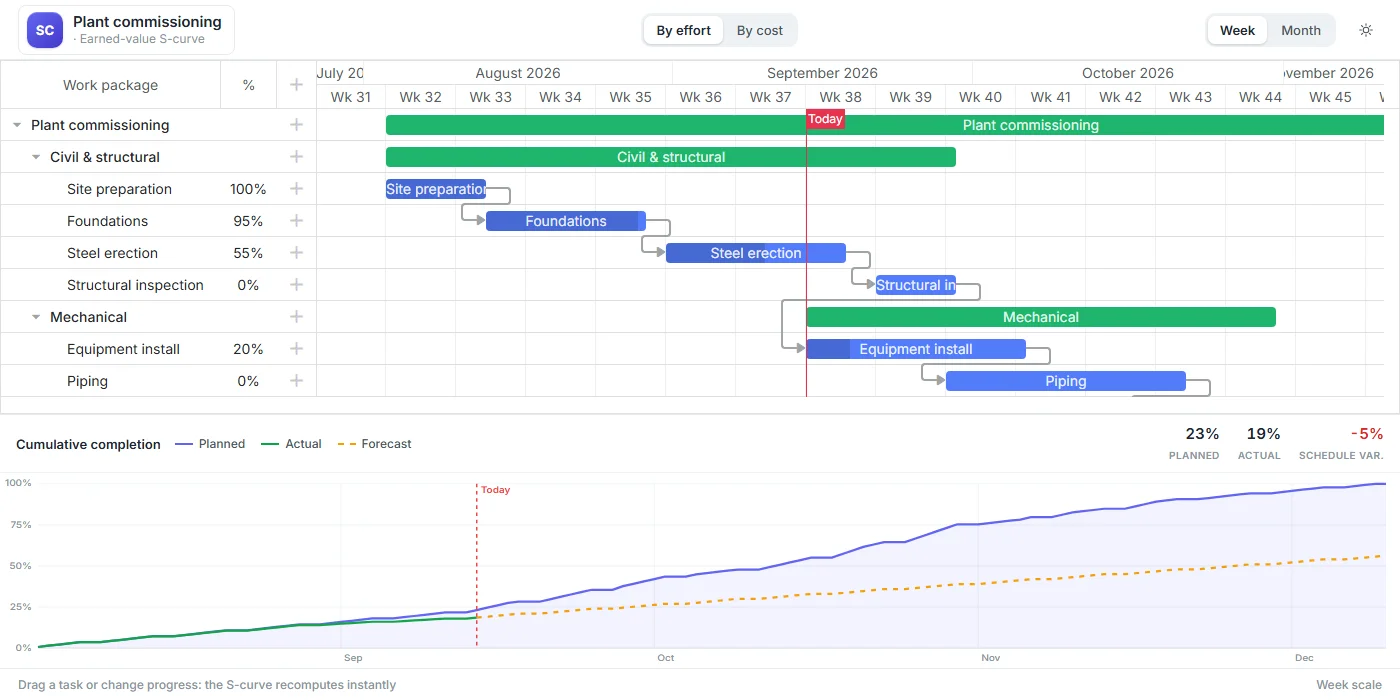
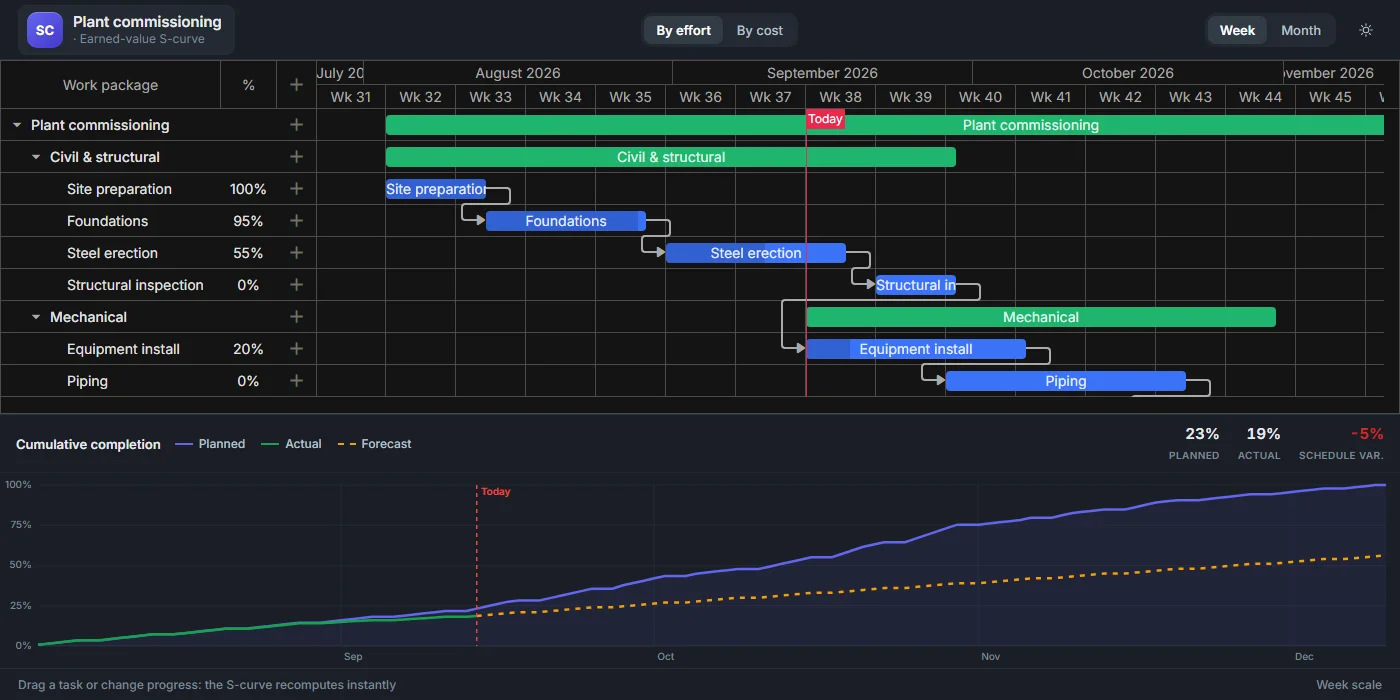
S-curve
Plot planned, actual, and forecast progress as an S-curve computed live from task effort and progress, drawn with no charting library.
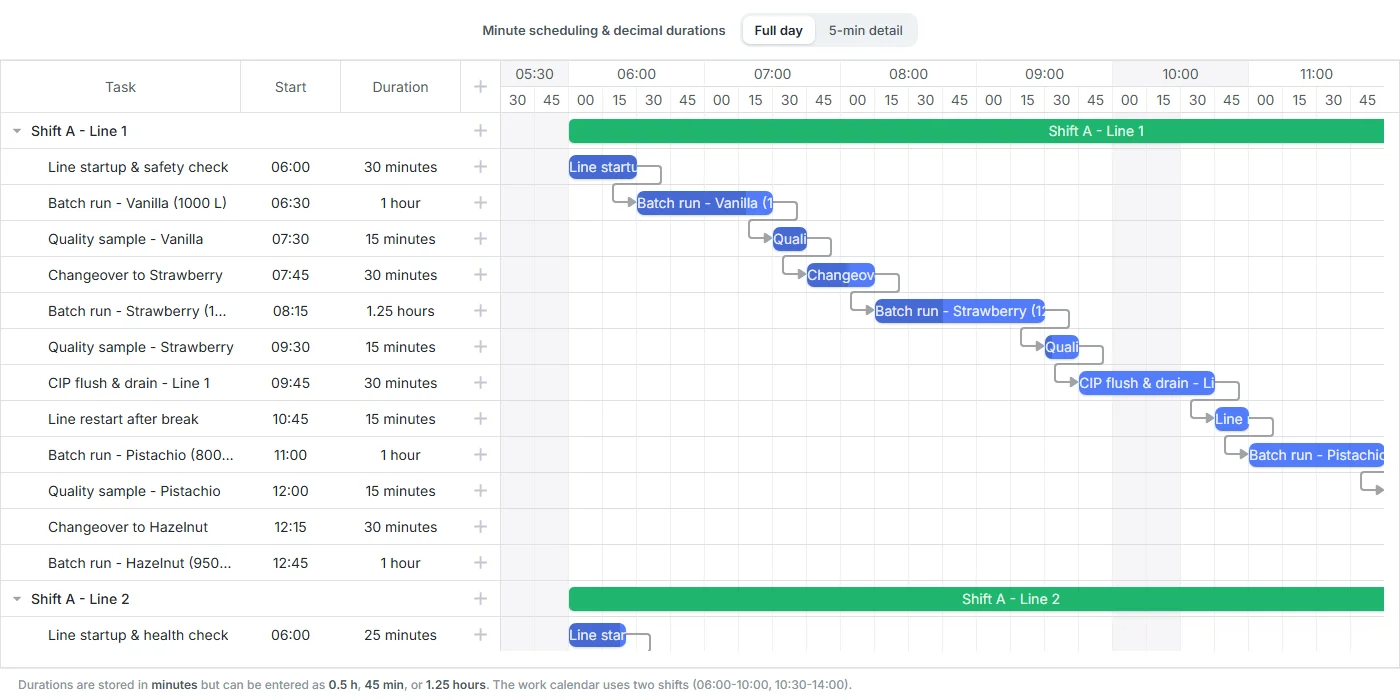
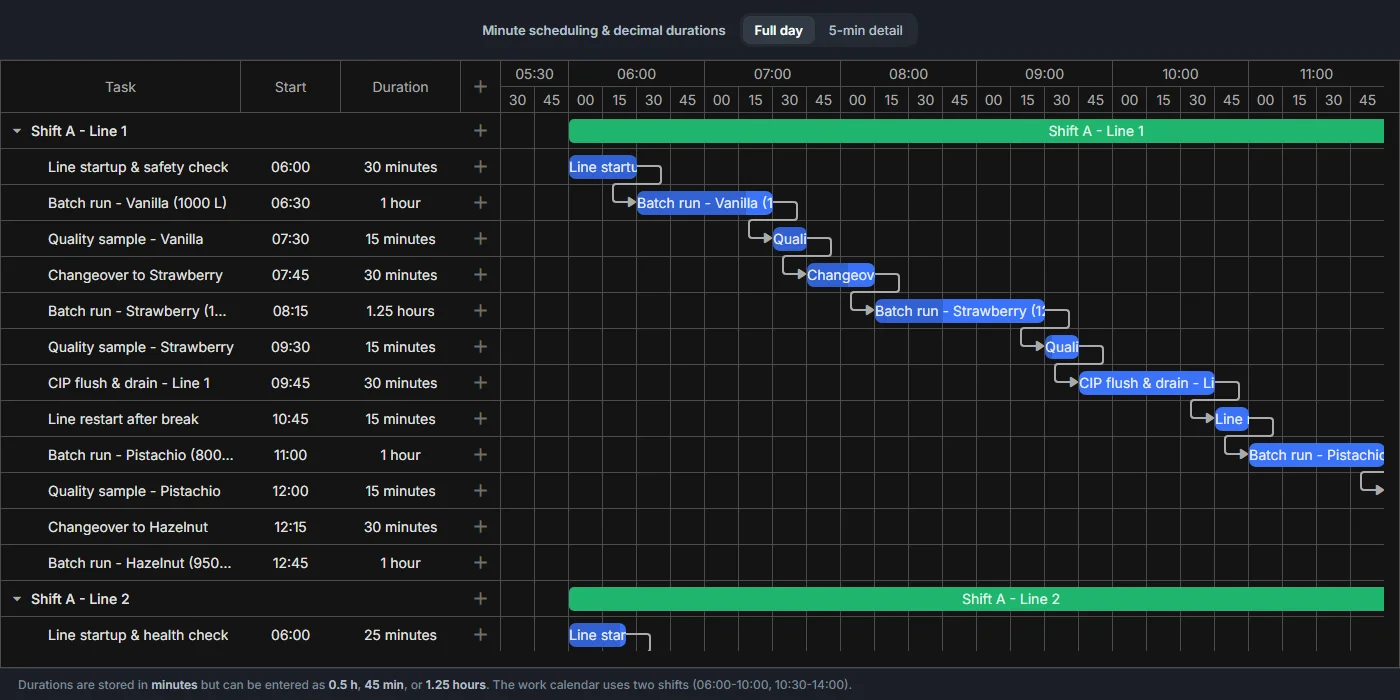
Minute scale
Plan a single production day in minutes, switching between a full day view and fifteen minute detail across two shifts.
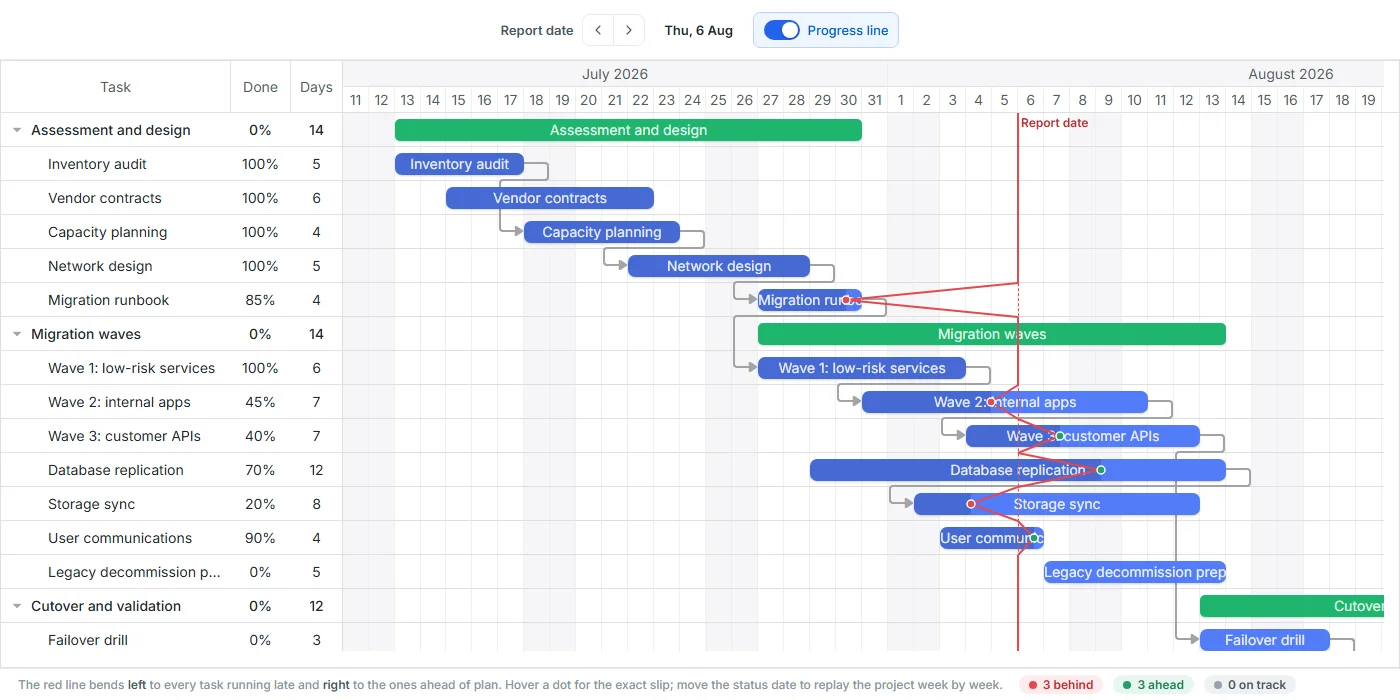
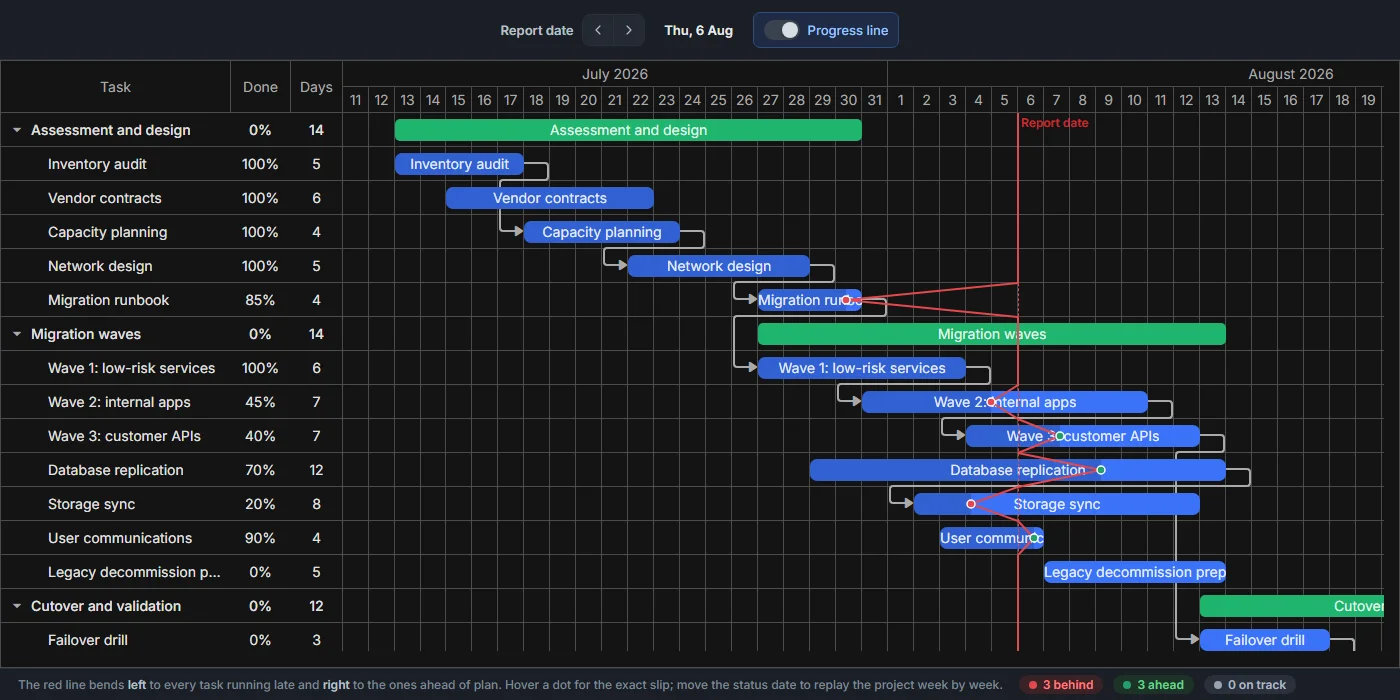
Progress line
Bend a progress line at the status date so it points left to tasks running late and right to those ahead of plan, with hover dots showing the exact slip.
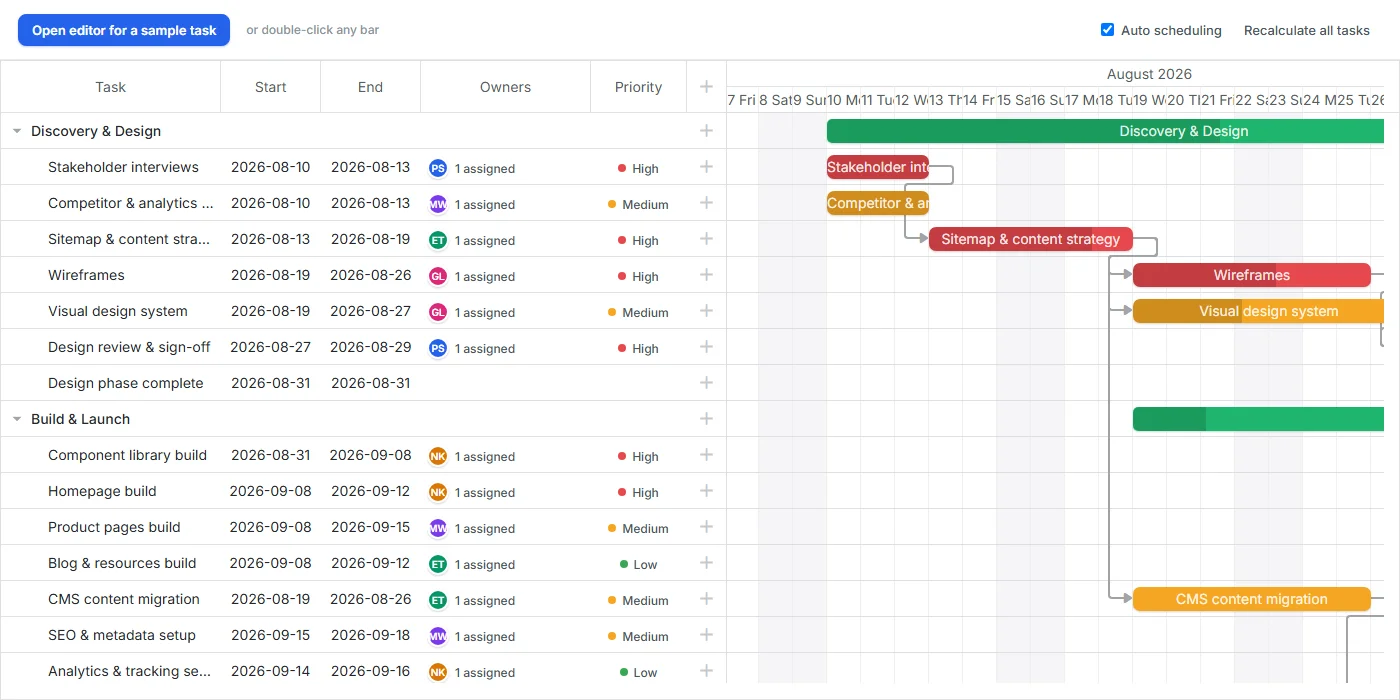
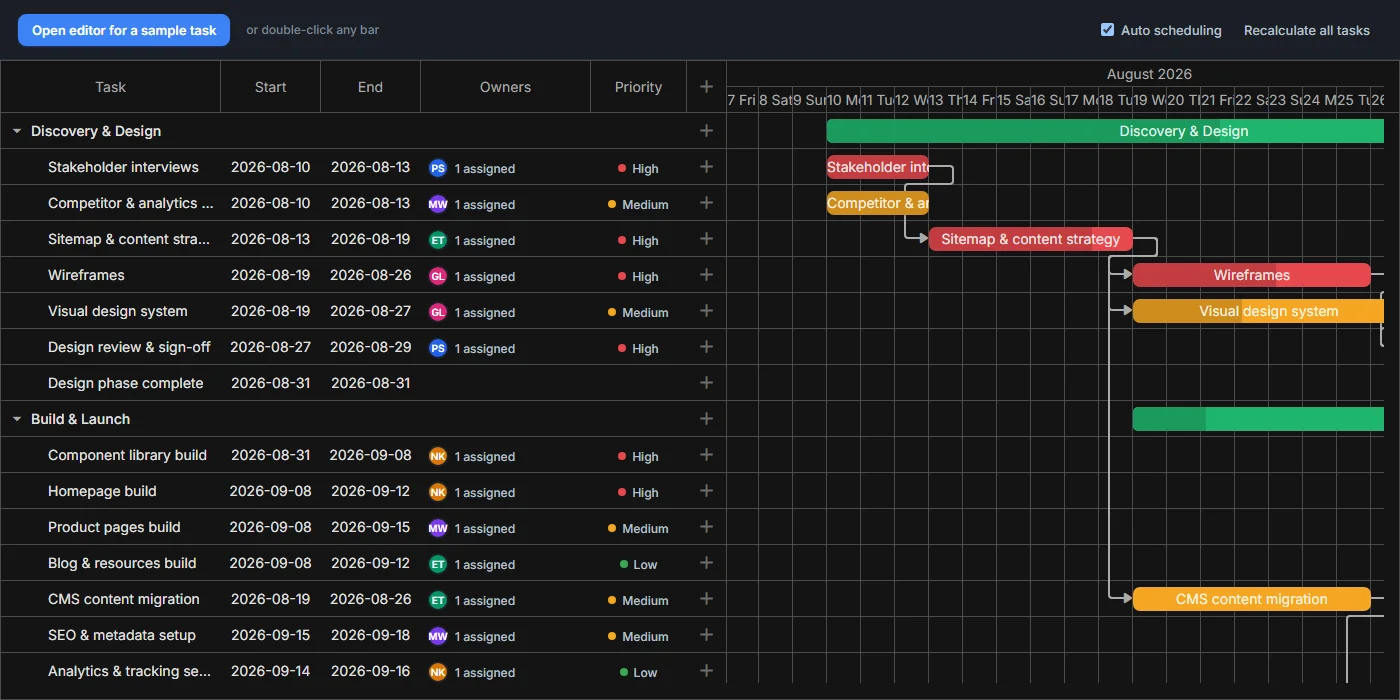
Custom task editor
Replace the default lightbox with a custom editor that opens on double click and follows the host product's own look and layout.
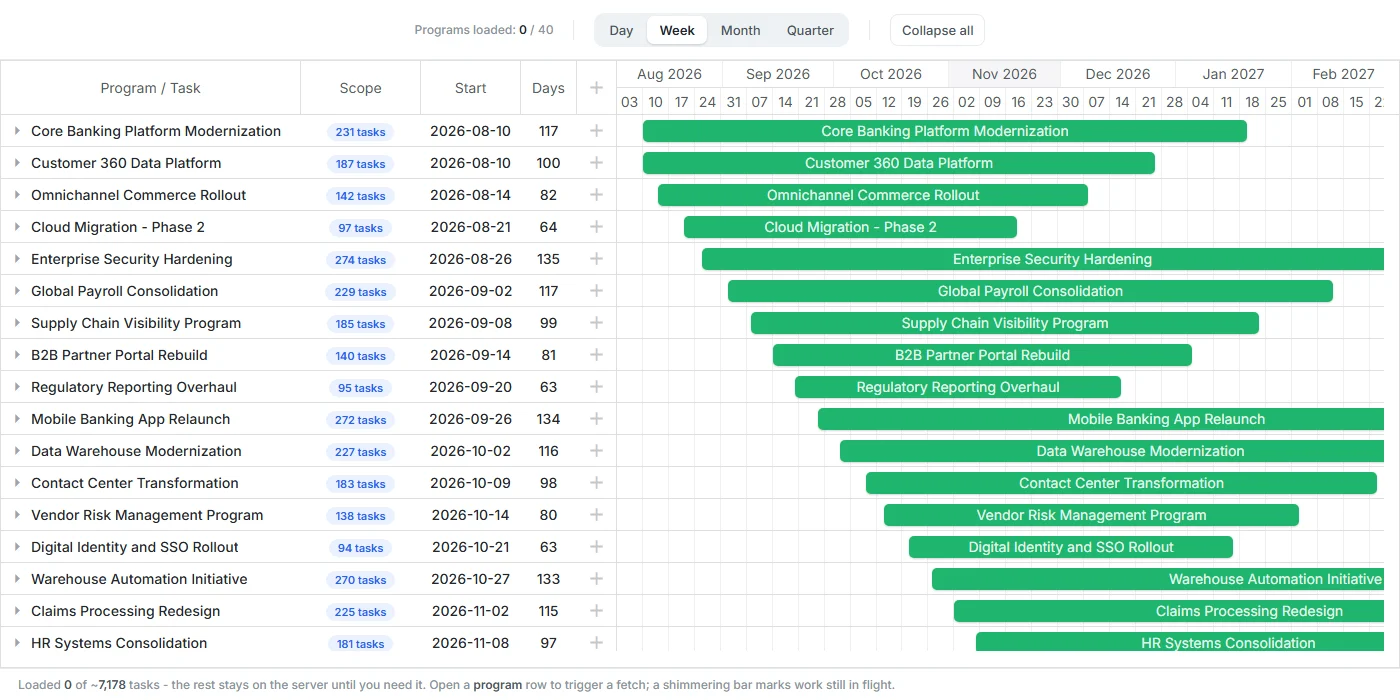
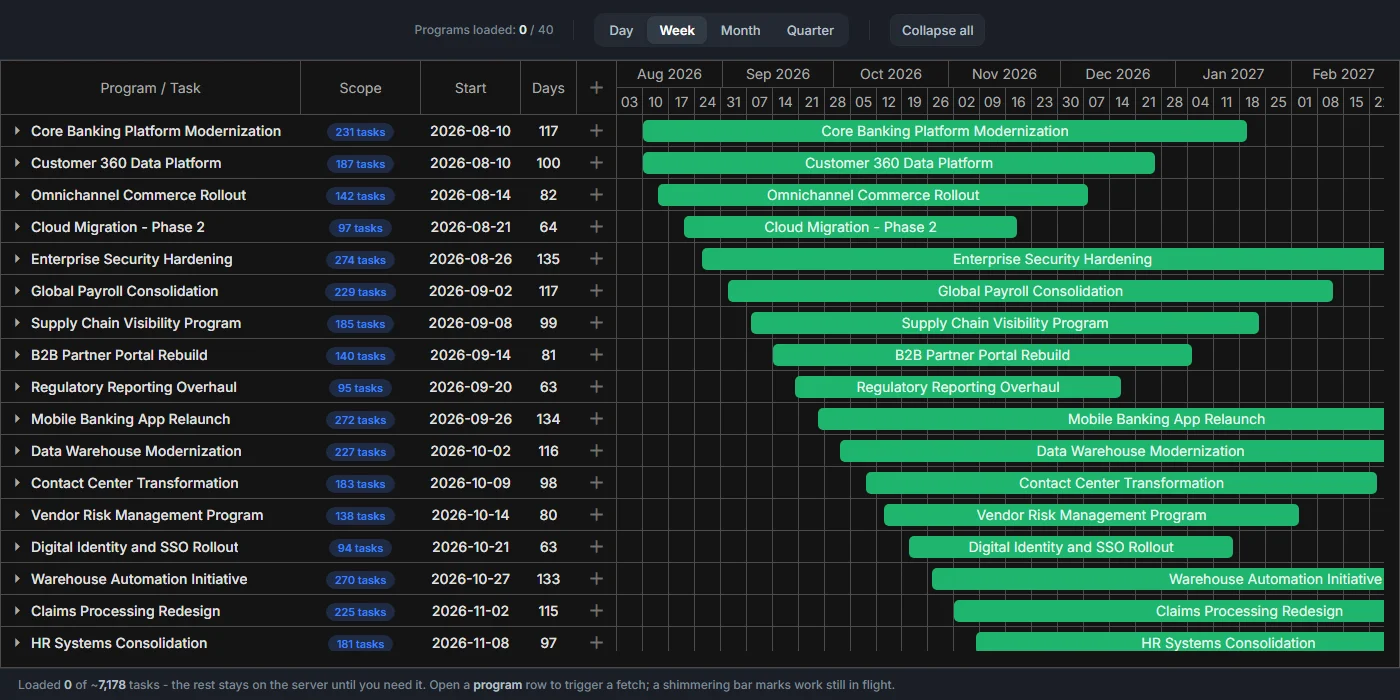
On-demand branch loading
Keep subtasks on the server and fetch a branch only when its parent row is expanded, with a shimmering bar marking requests still in flight.
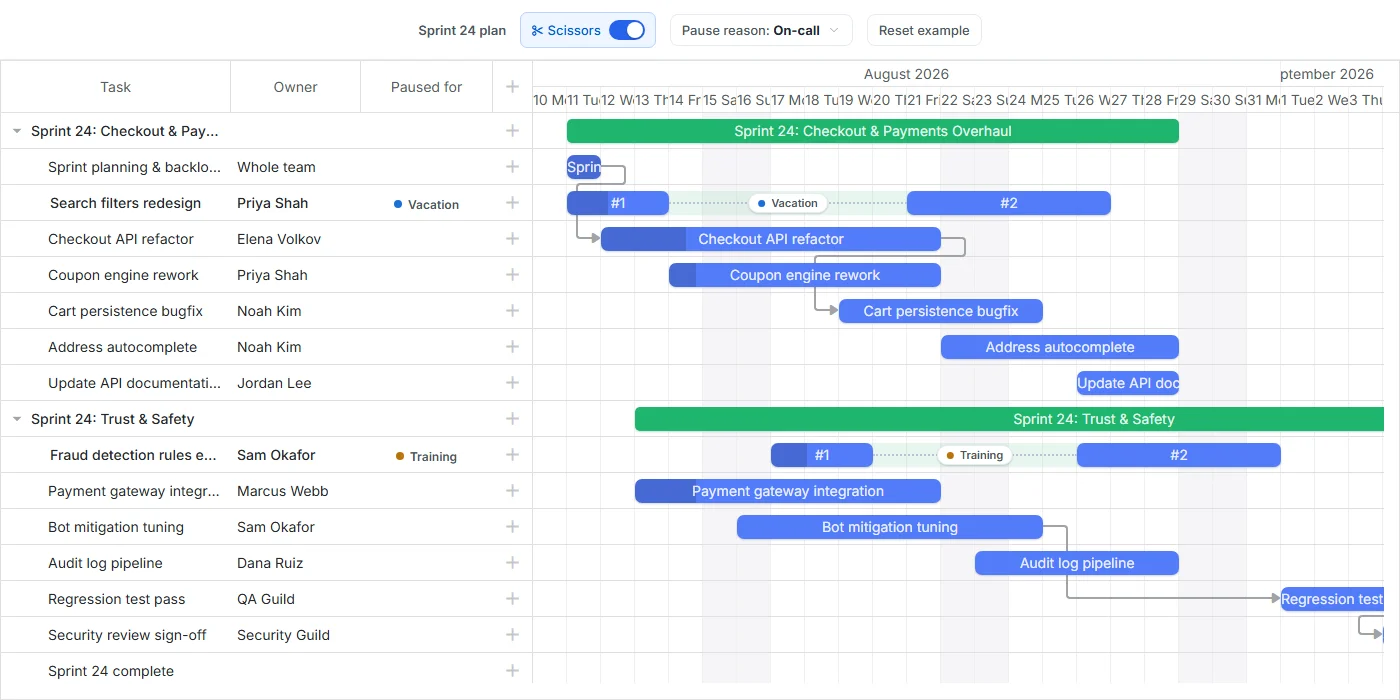
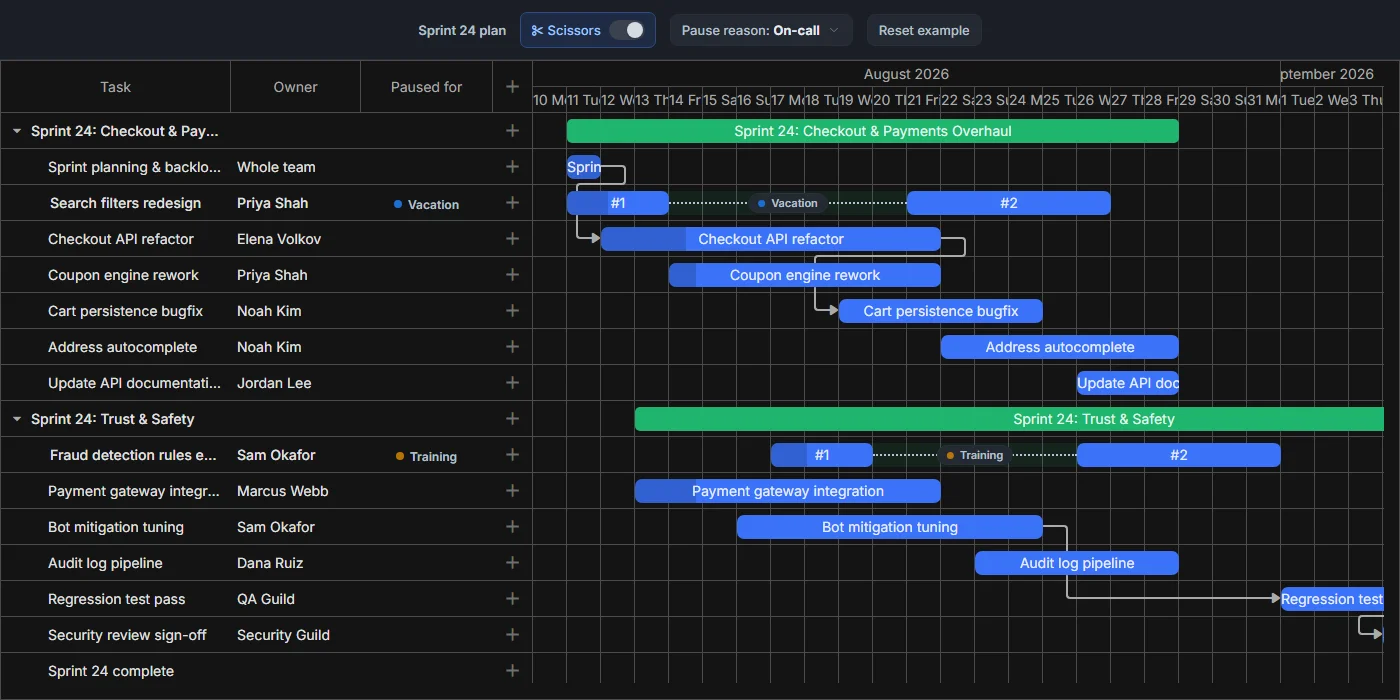
Split tasks
Cut a task into segments with a scissors tool where work pauses, keeping the pieces on one row with a labeled gap between them.
React
12 examples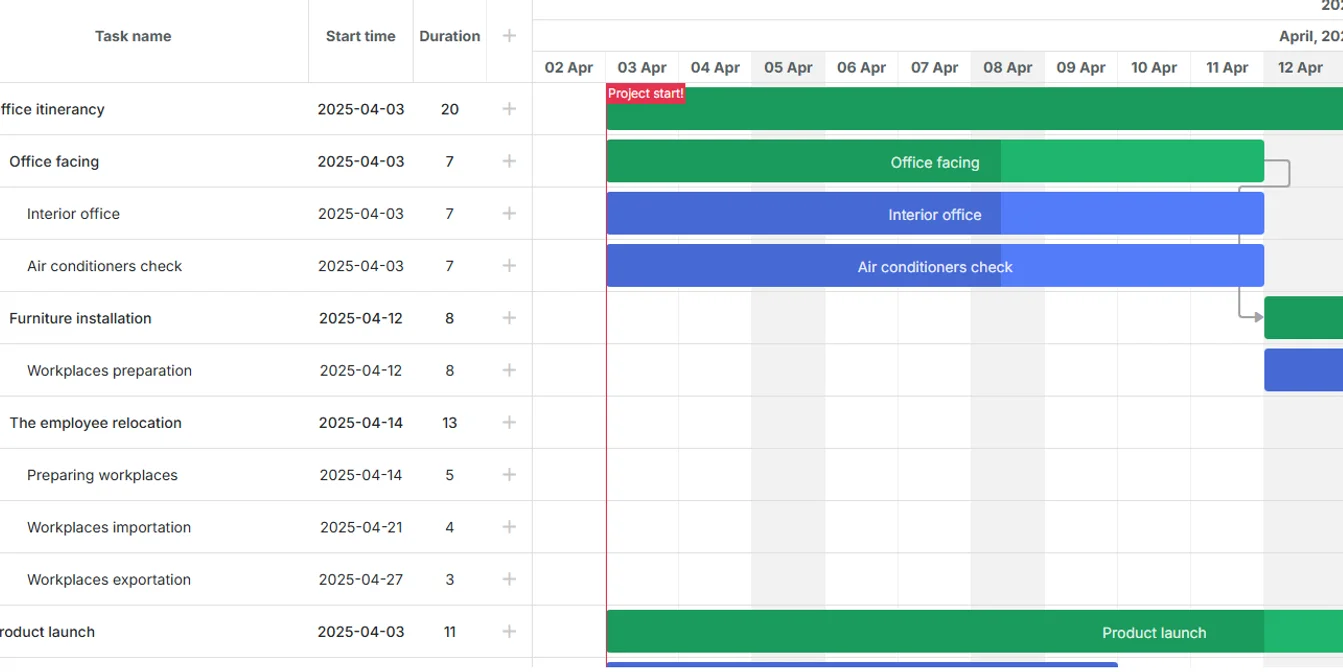
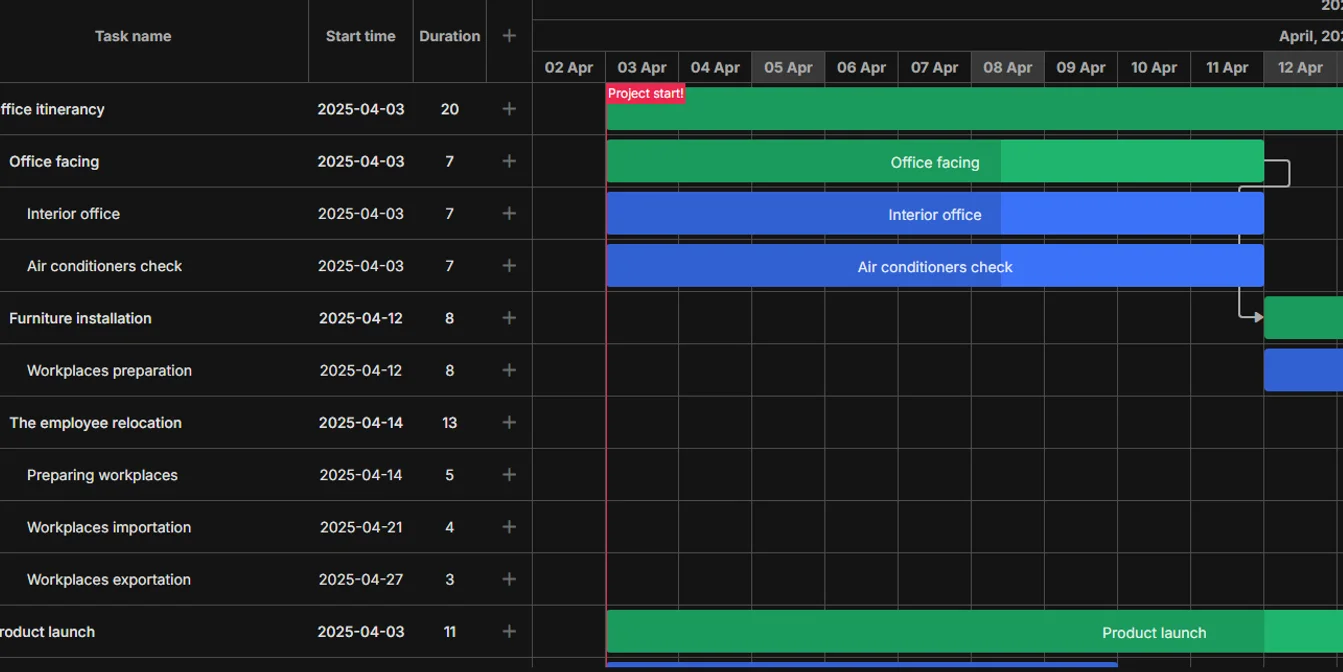
Basic initialization
Create a React Gantt instance with tasks, links, calendars, markers, and a working configuration.
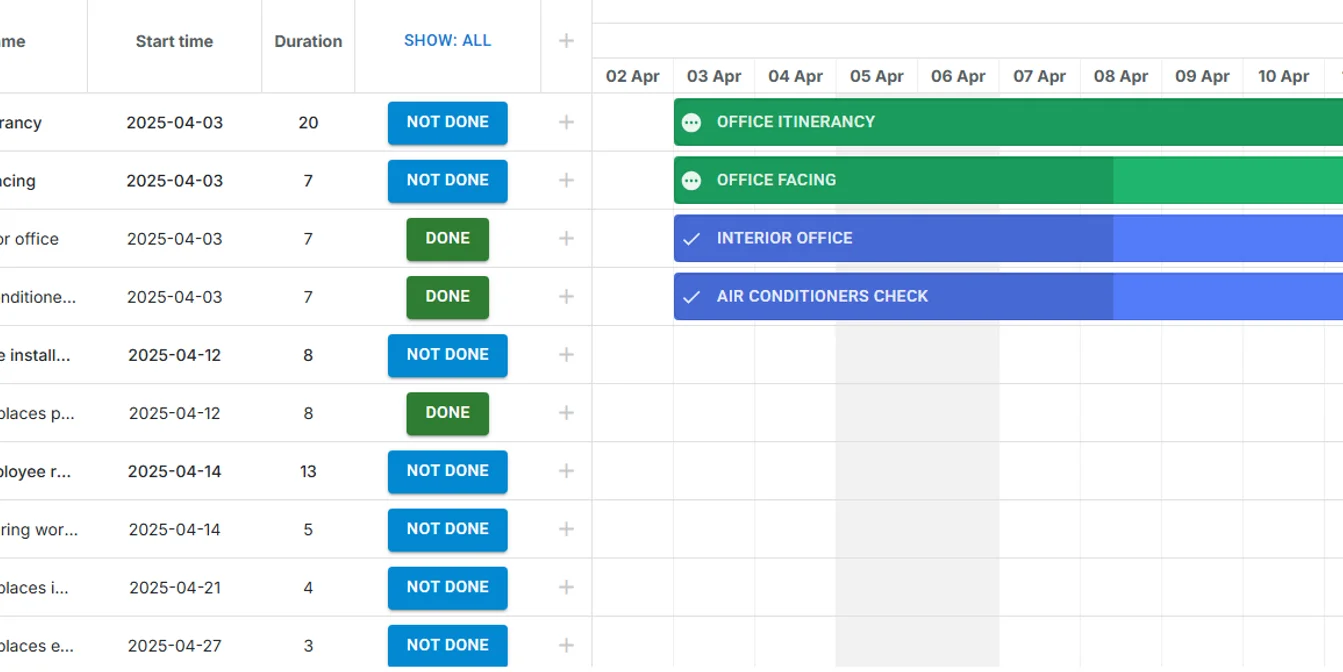
Templates
Customize task text, controls, headers, and delete confirmation UI with React template components.
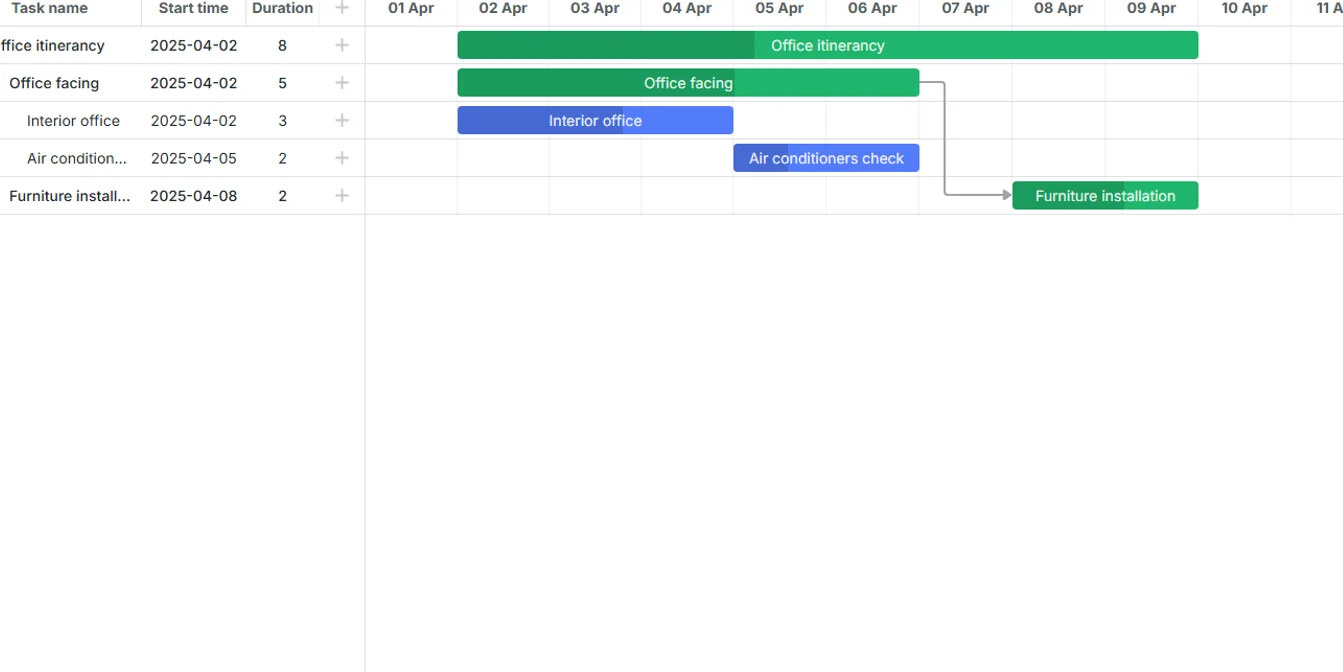
Custom form
Replace the default task editor with a draggable Material UI modal form.
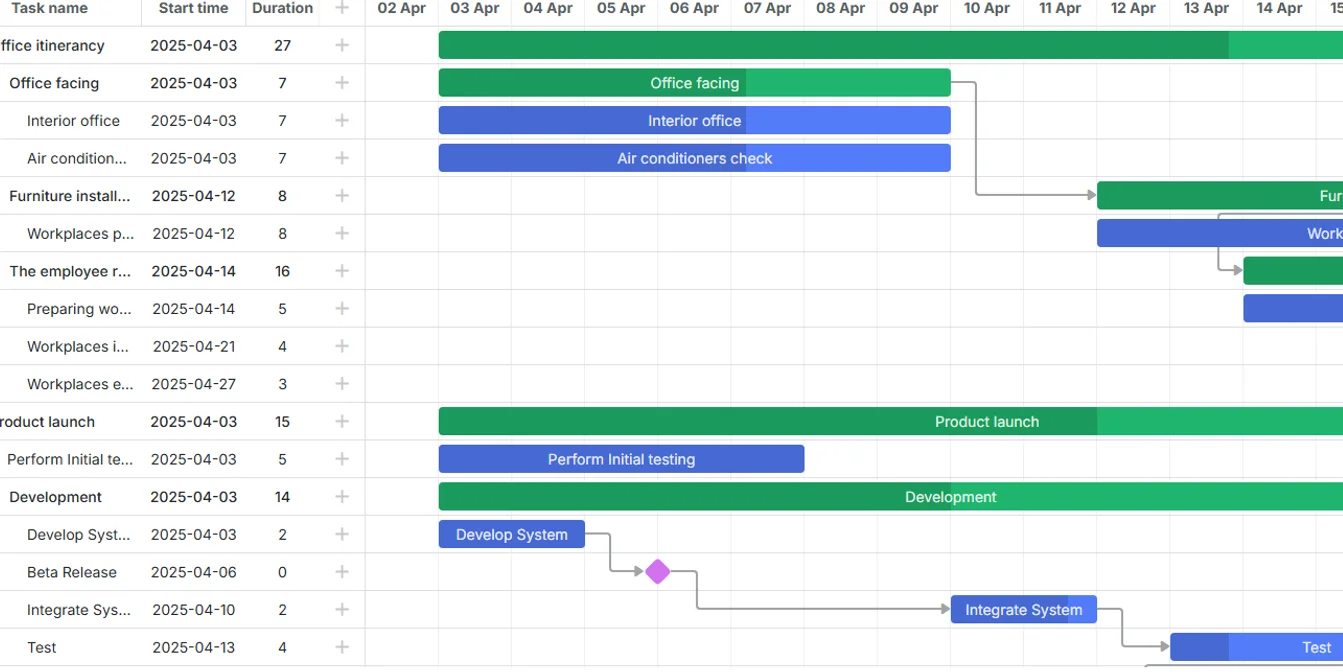
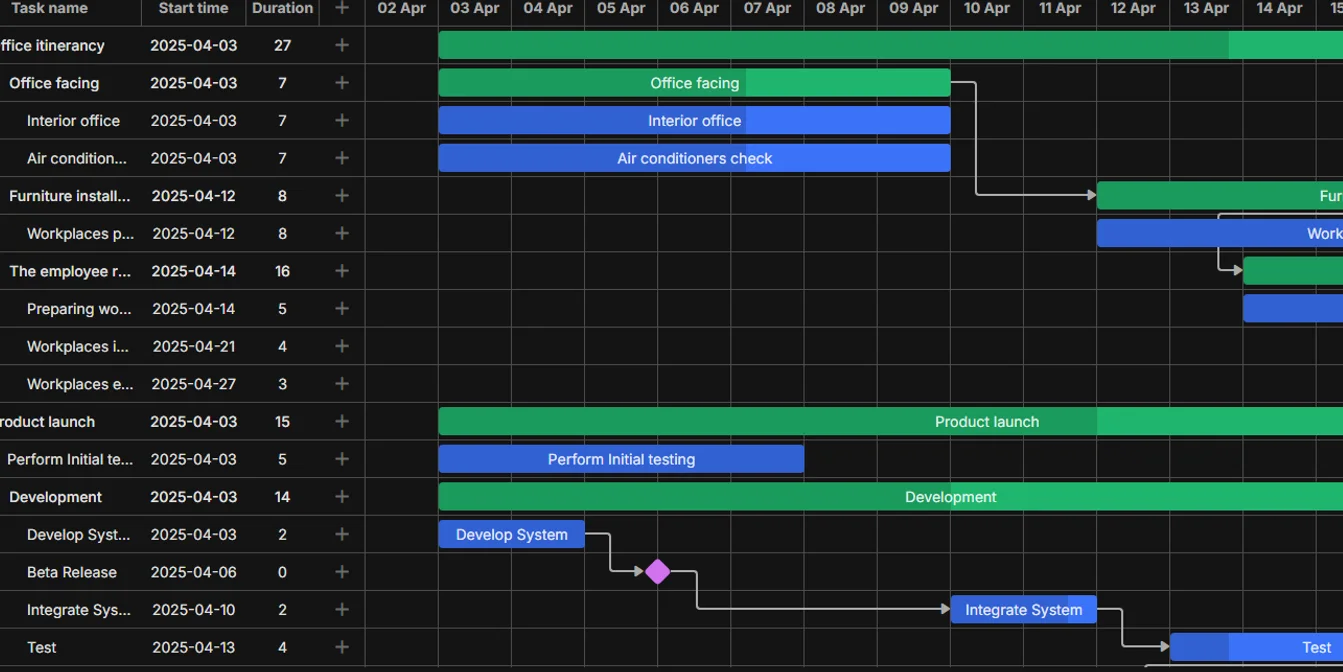
Custom edit view
Split task editing into a dedicated React Router view with shared Gantt context.
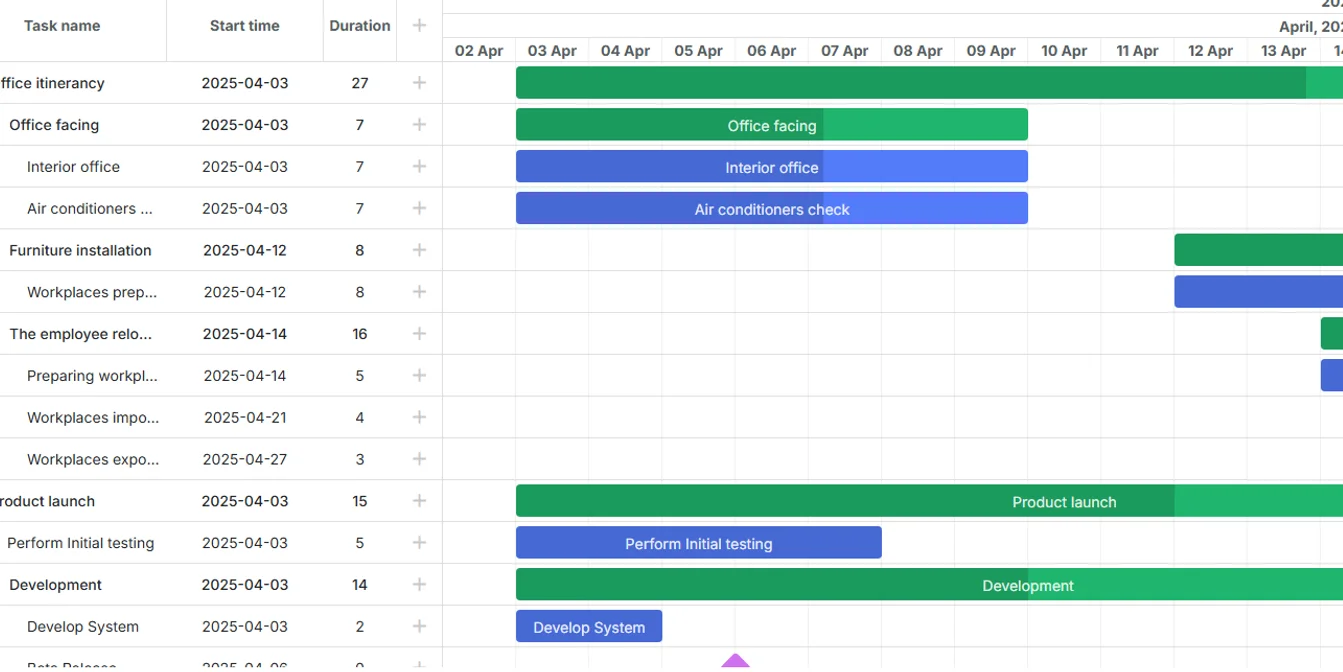
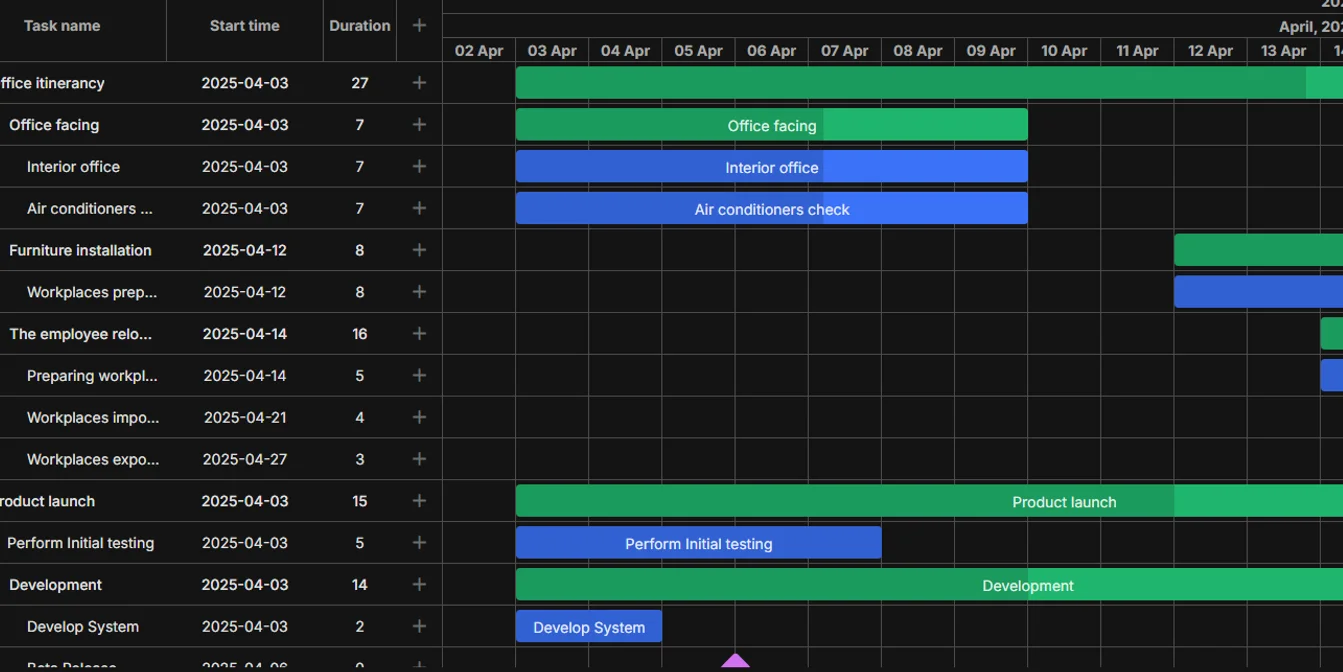
Inline editors
Use custom inline editors for text, duration, and date fields directly in the Gantt grid.
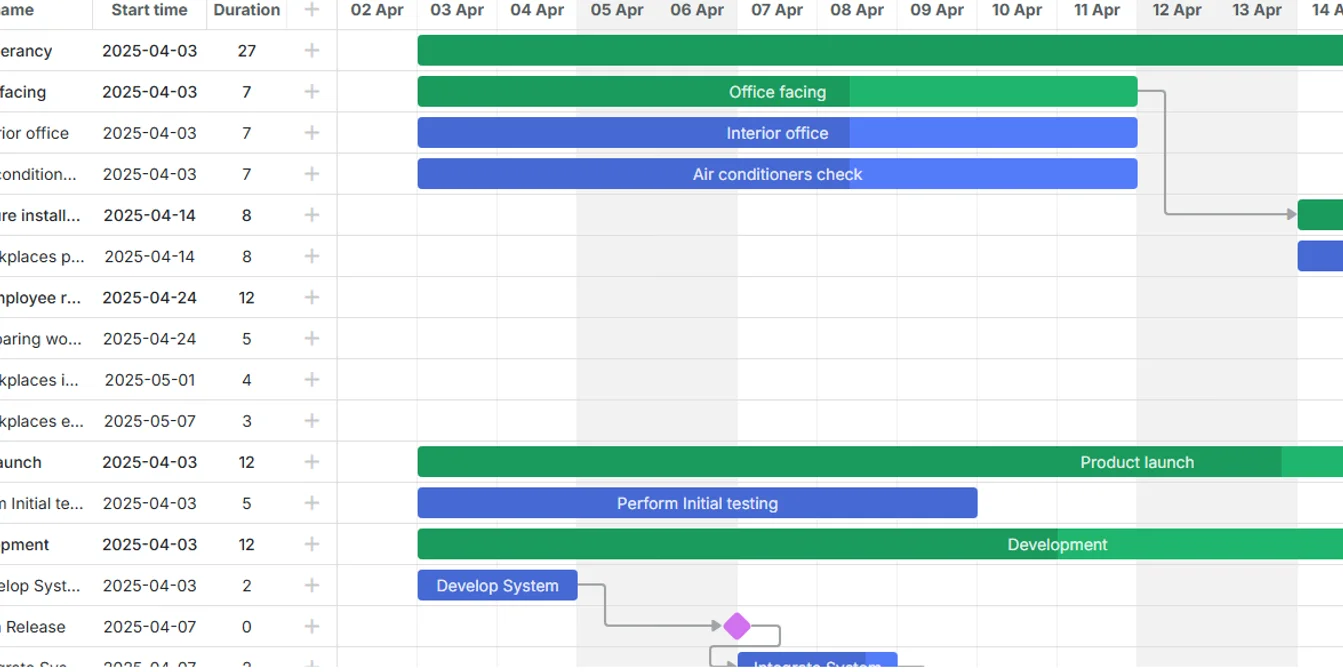
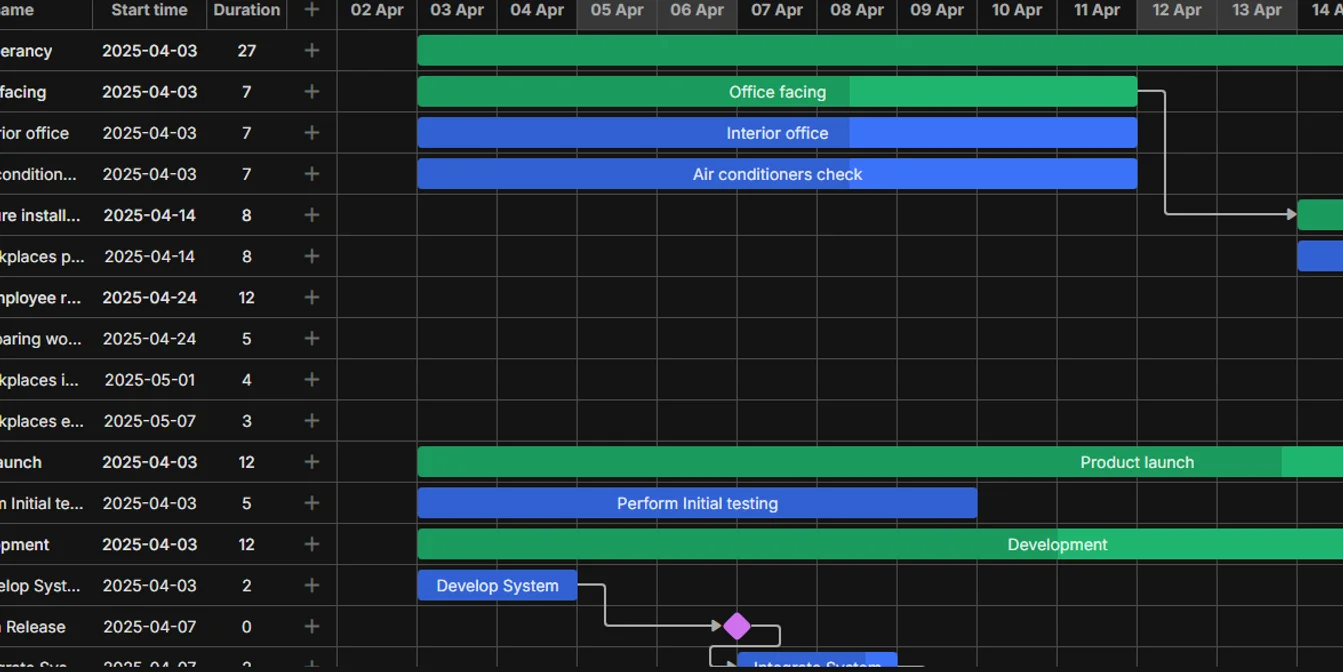
Auto scheduling
Move one task and every task linked after it moves too, with the critical path one button away.
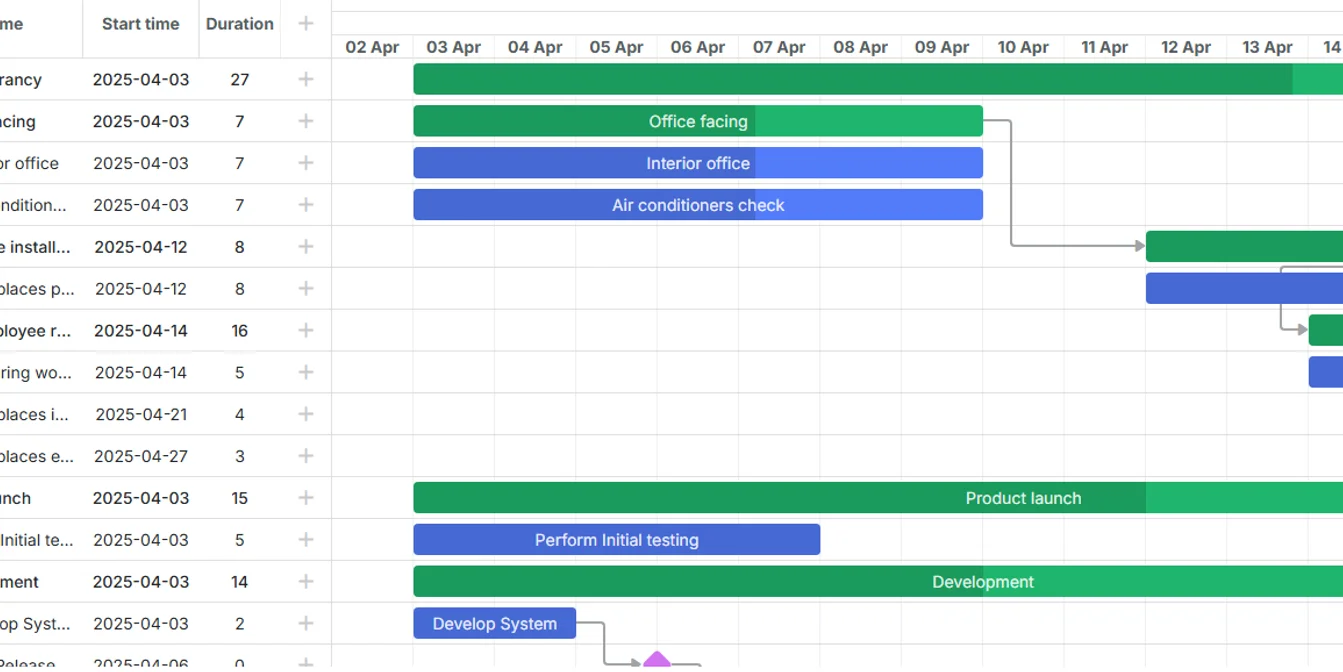
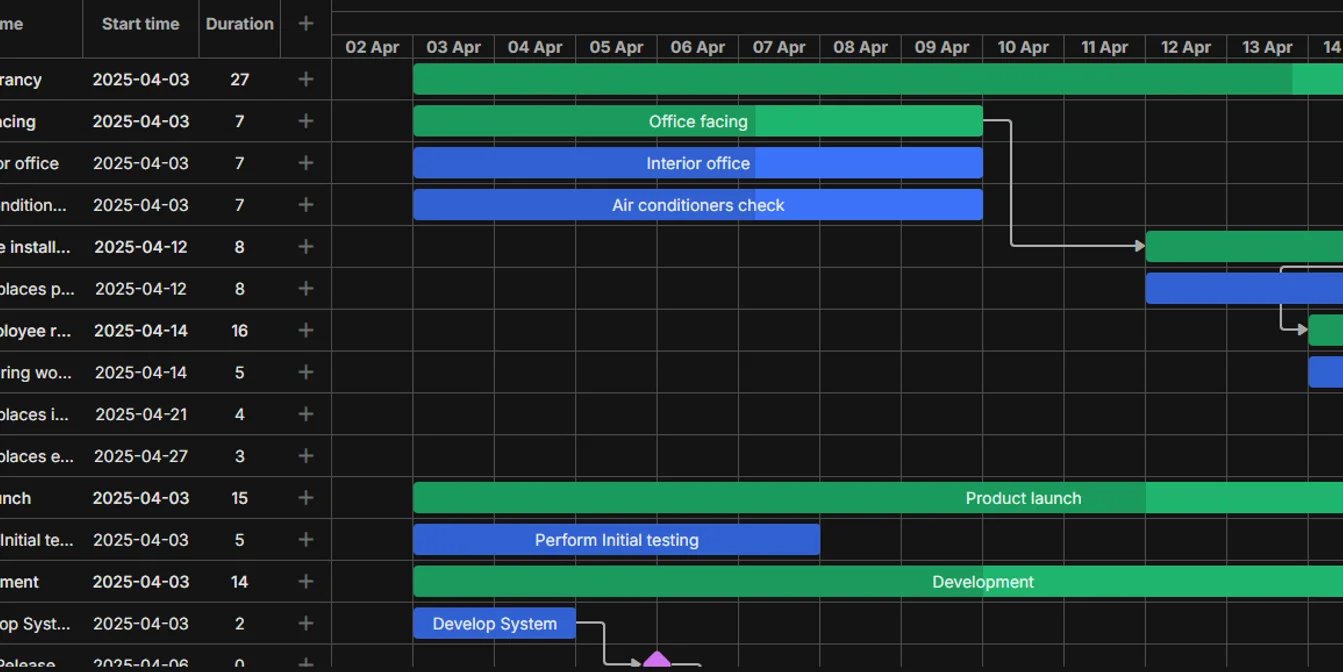
Export data
Read serialized task and link data from the React Gantt instance for export workflows.
Redux Toolkit
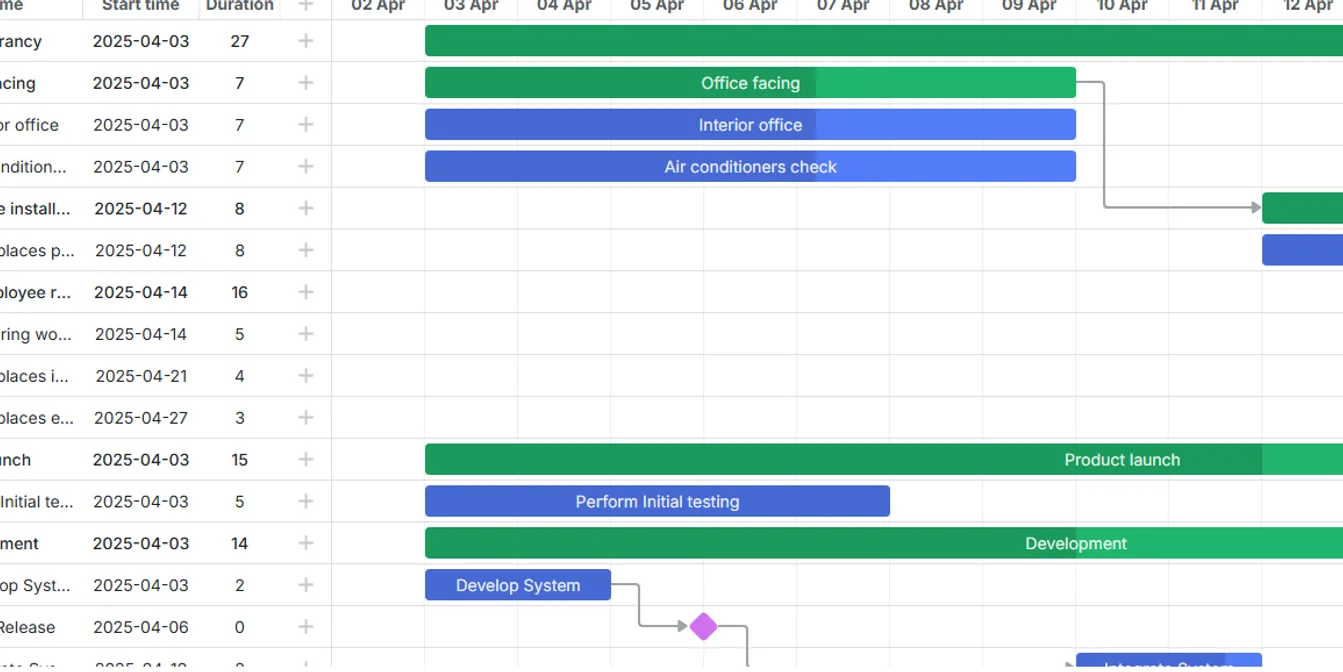
Keep Gantt tasks, links, history, undo, and redo state in Redux Toolkit.
Resource panel
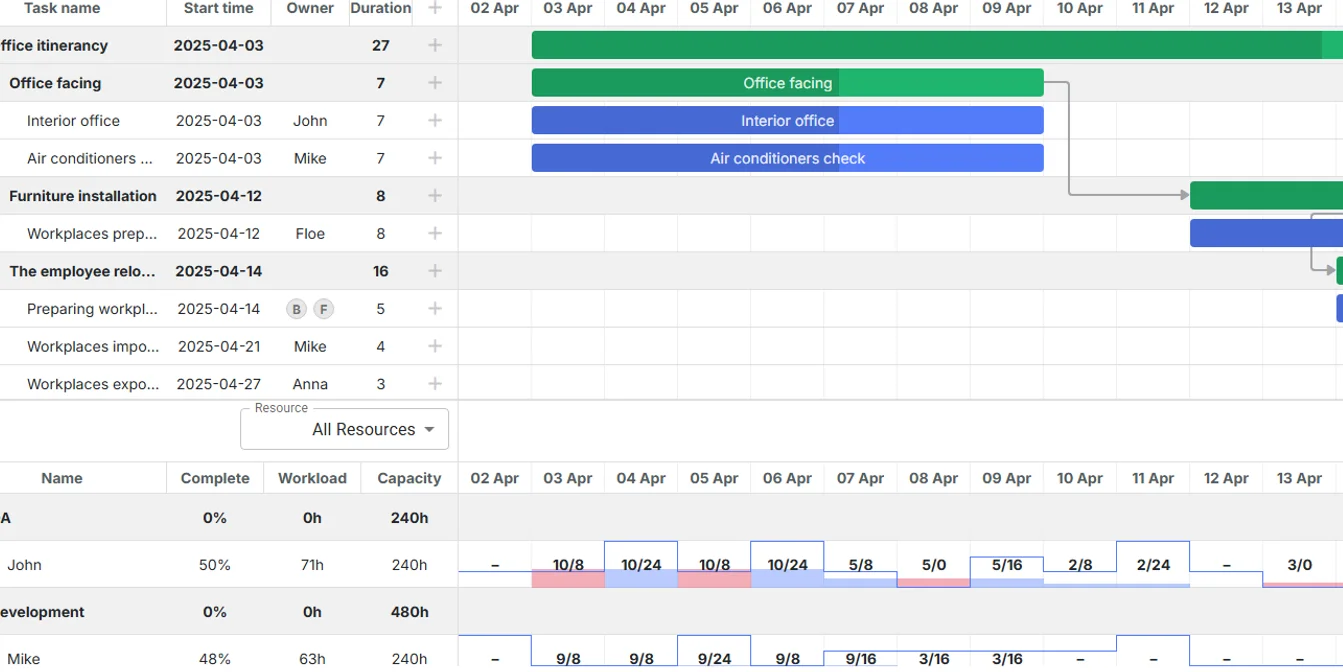
Show resource assignments and a histogram panel alongside the Gantt timeline.
Quick start
Minimal Vite-based React project that mounts a Gantt chart with tasks and links, ready to clone and run.
Next.js starter
Next.js project that renders a Gantt chart in a client component, with task and link data wired in.
Remix starter
React Router project that renders a Gantt chart inside a route, with task and link data wired in.
Angular
11 examples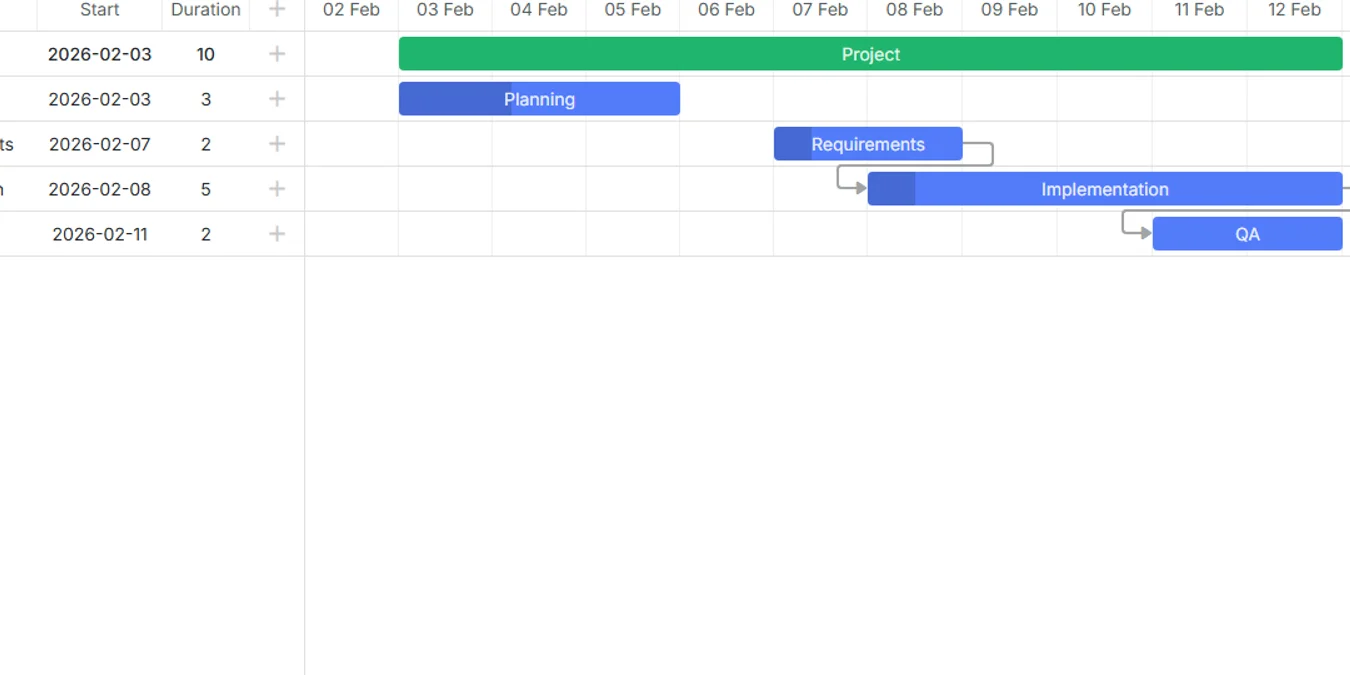
Basic initialization
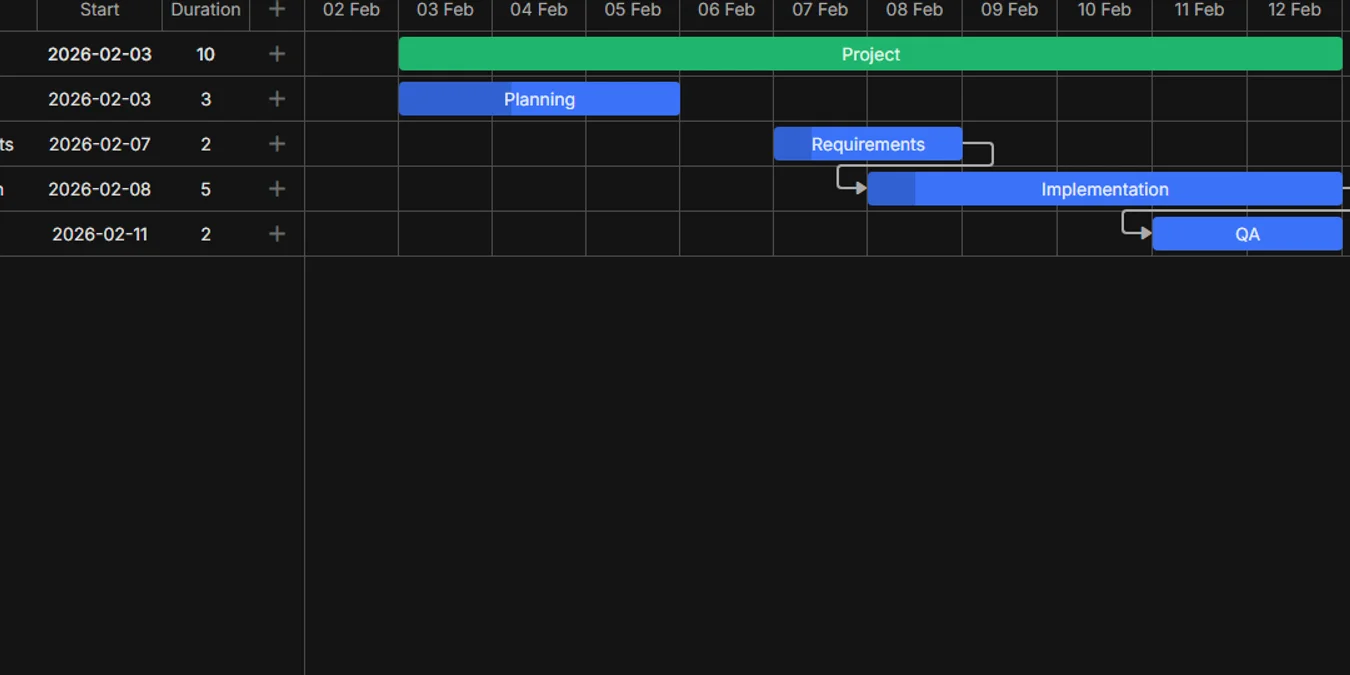
Create an Angular Gantt instance with the DhxGanttComponent, tasks, links, and a working configuration.
Configs and templates
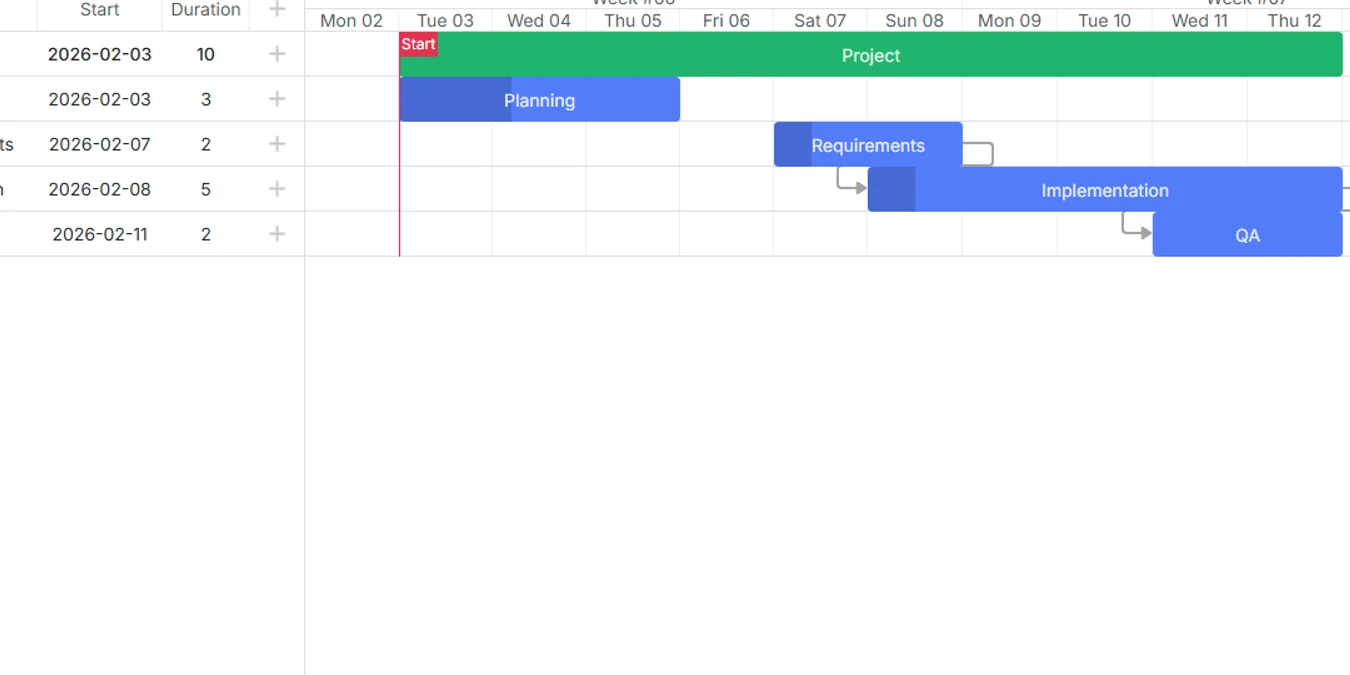
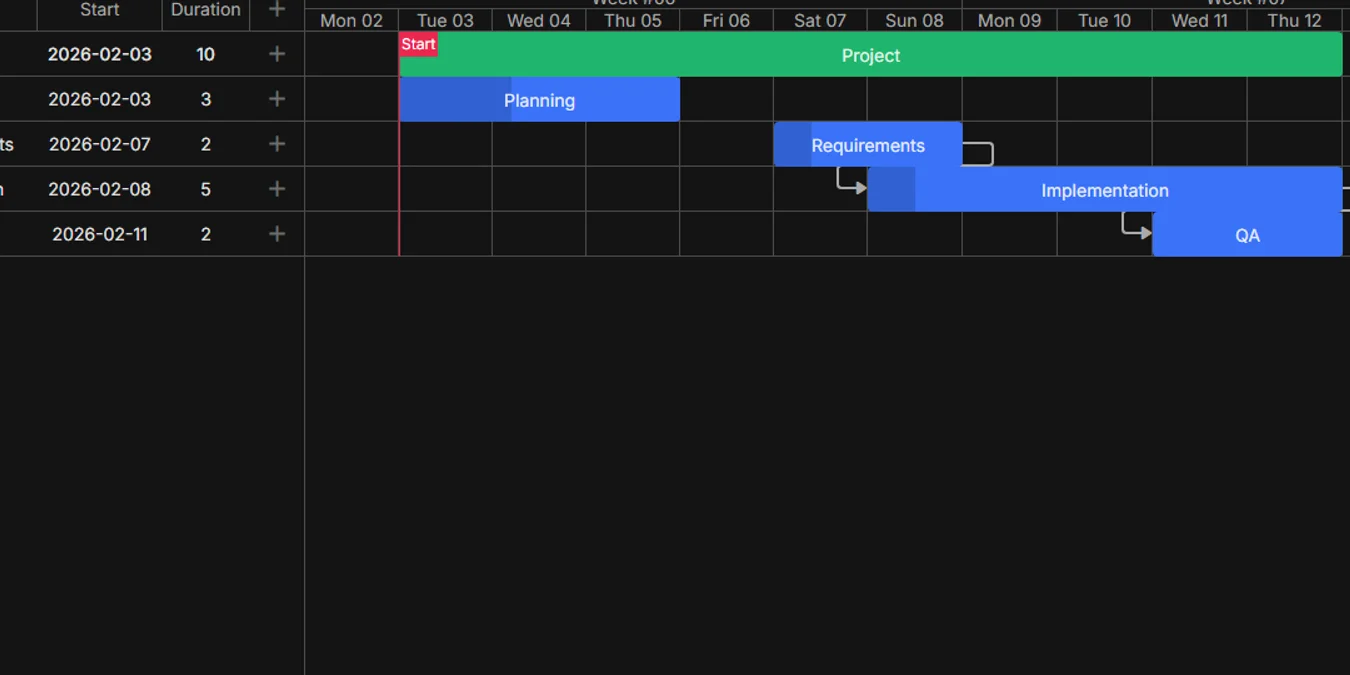
Toggle scales, markers, and progress templates through a reactive Angular config getter.
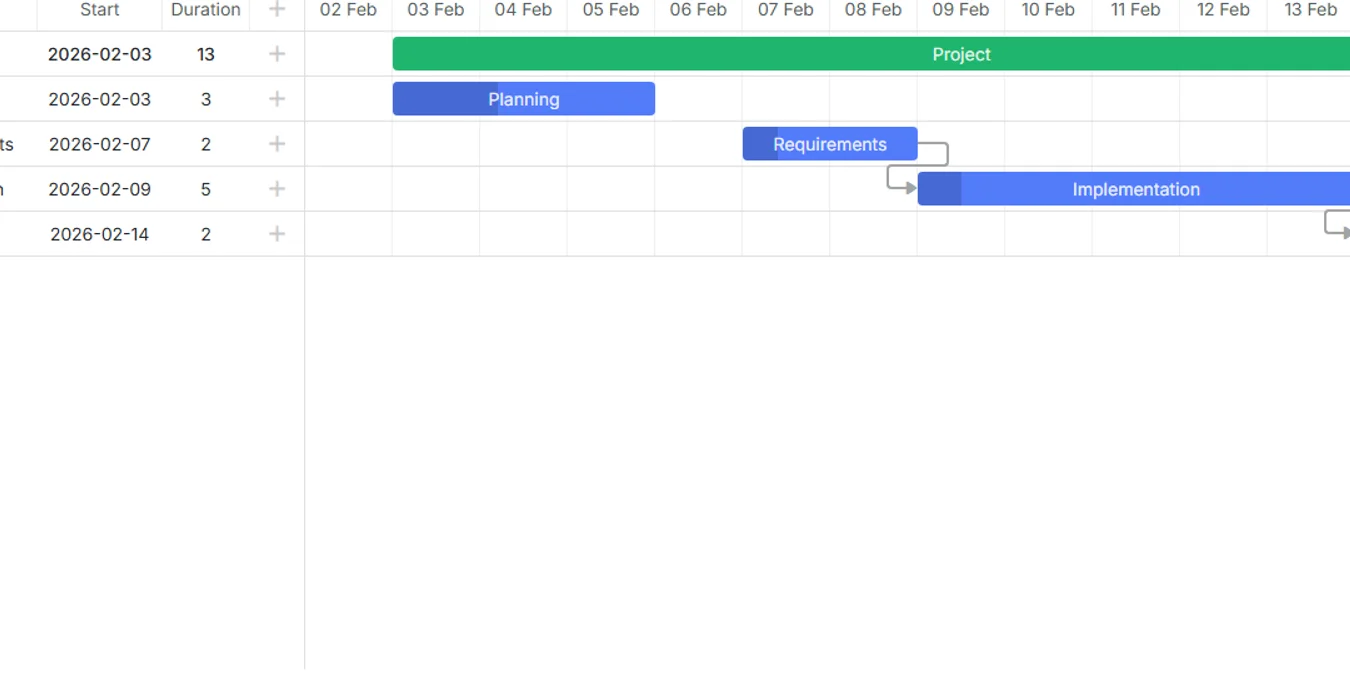
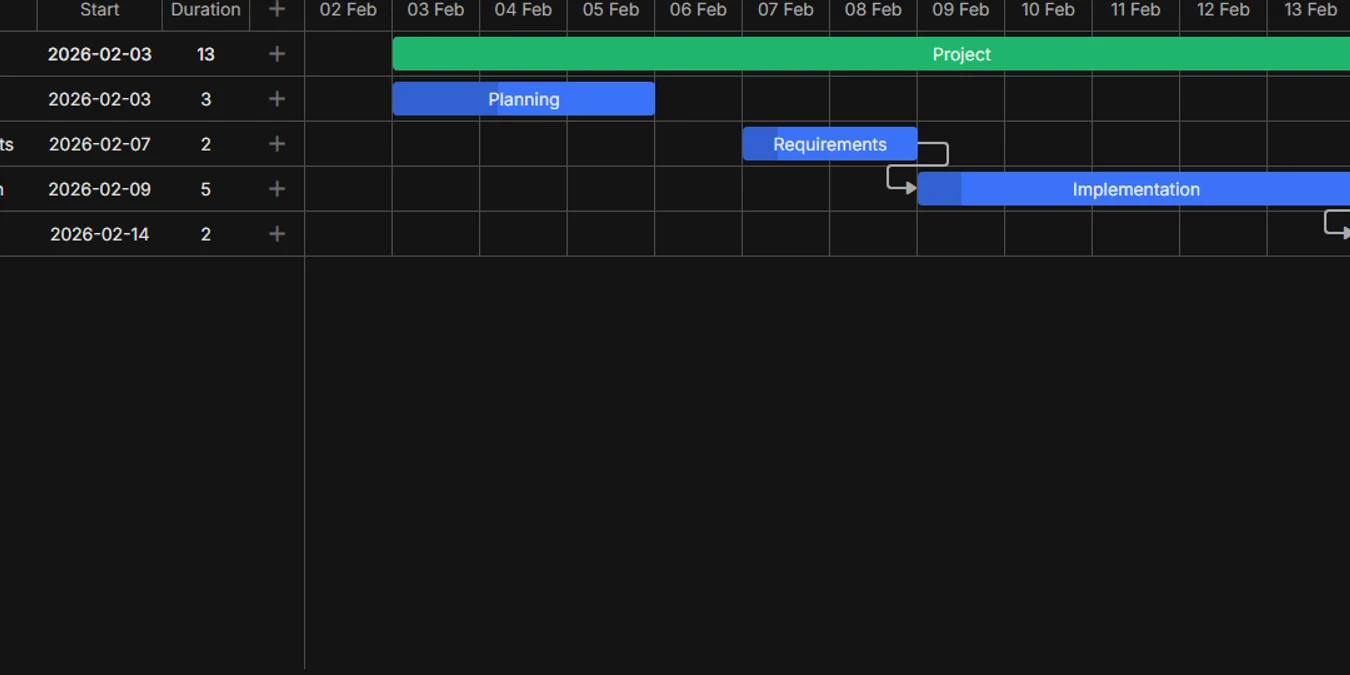
Auto scheduling
Recalculate dependent tasks and links when schedule changes should cascade through a project.
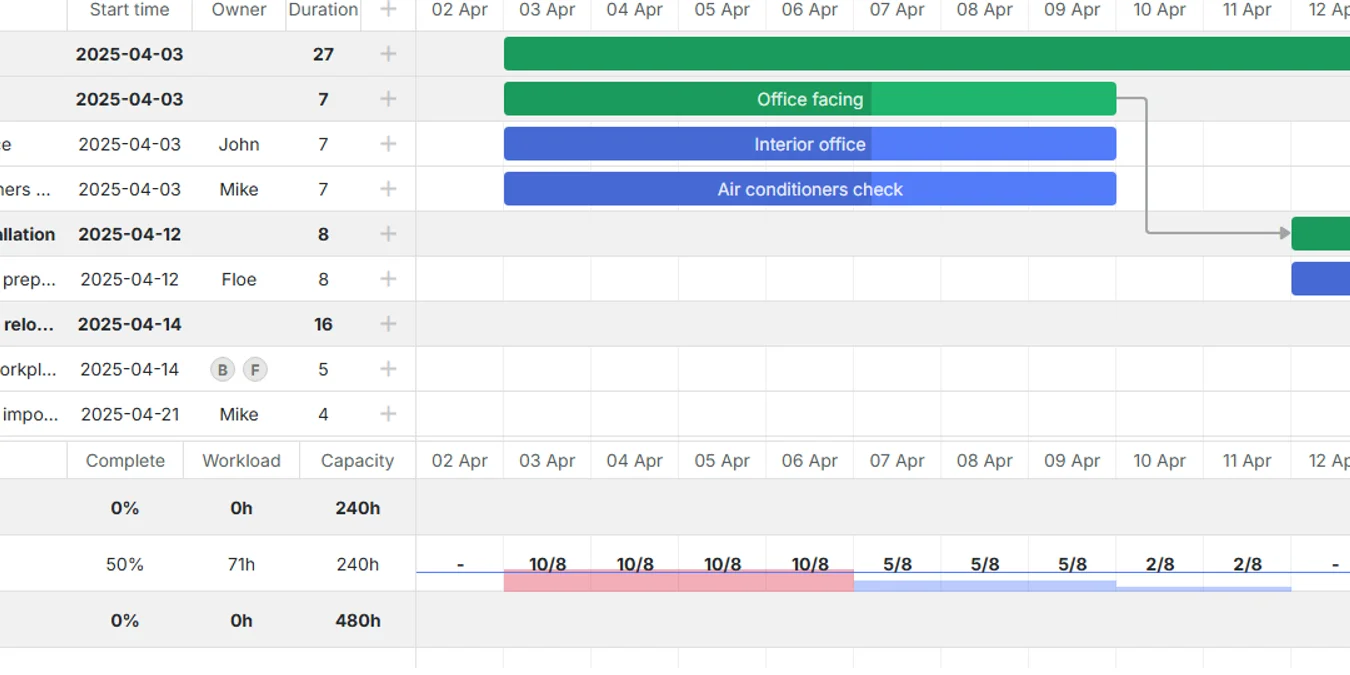
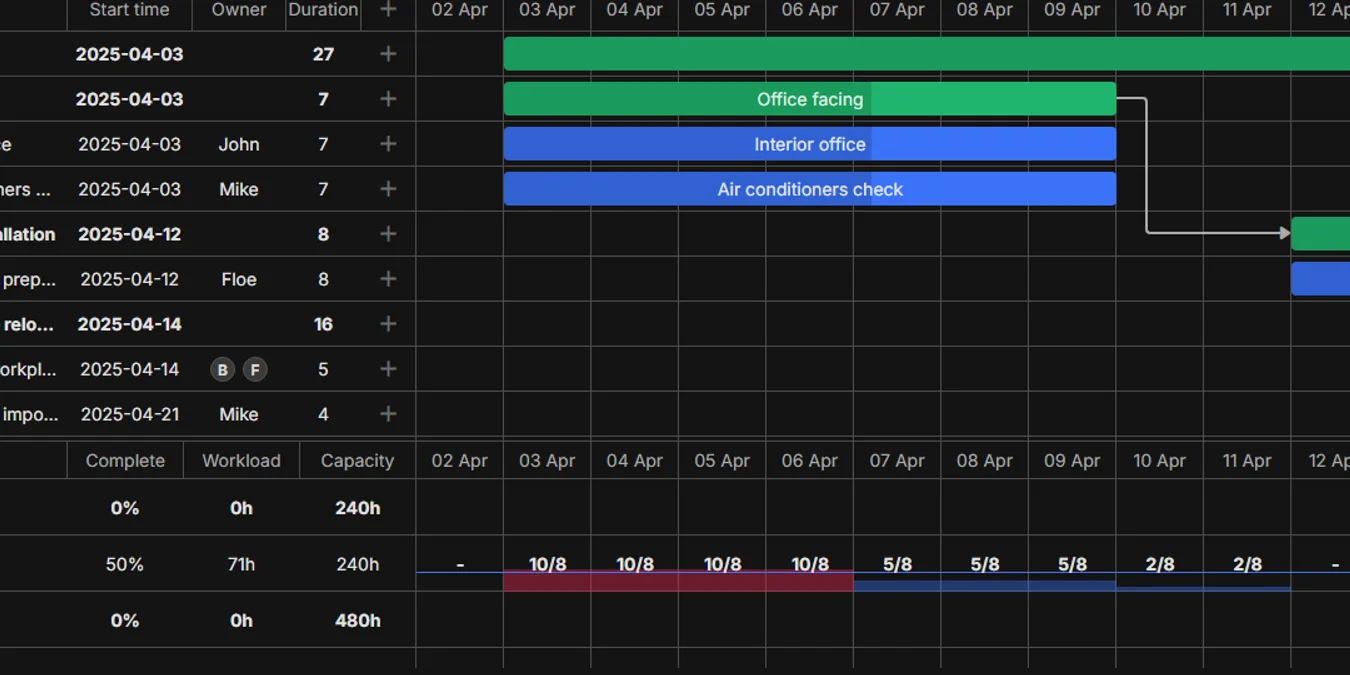
Resource panel
Show resource assignments, a histogram panel and filtering alongside the Angular Gantt timeline.
Calendars
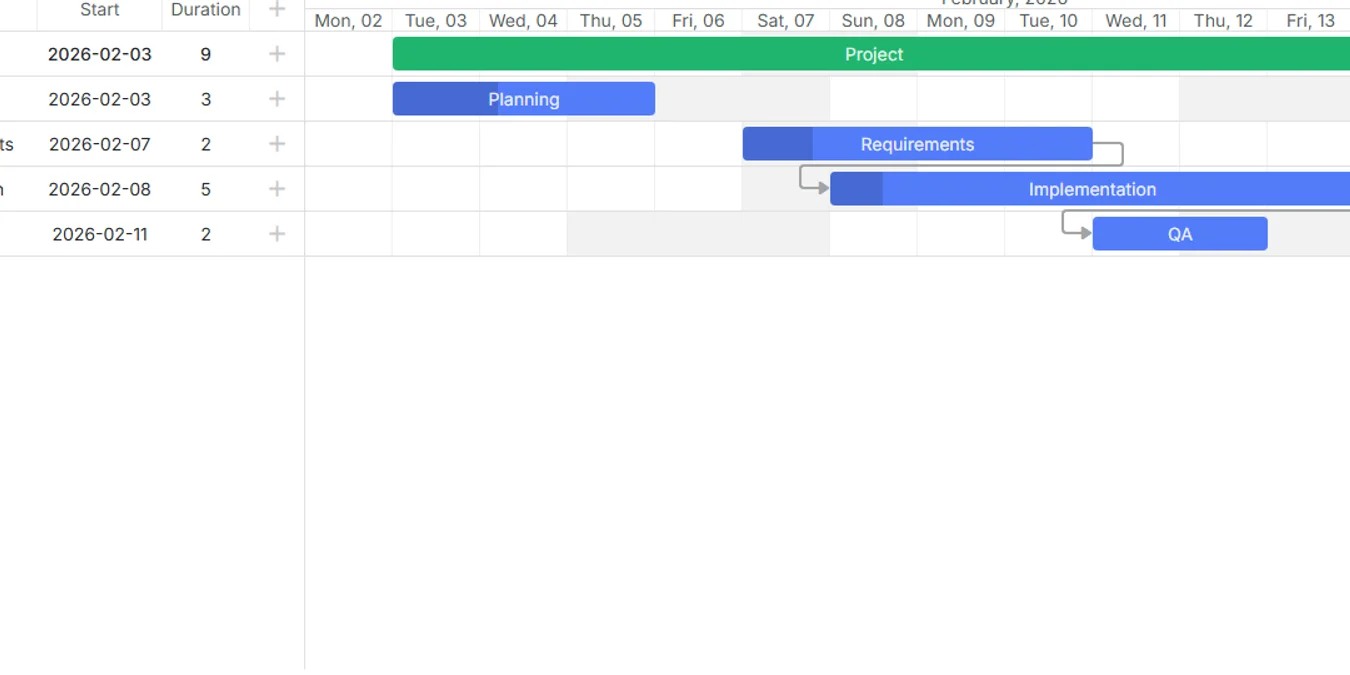
Apply custom work calendars and locales to control working time per task.
Inline editors
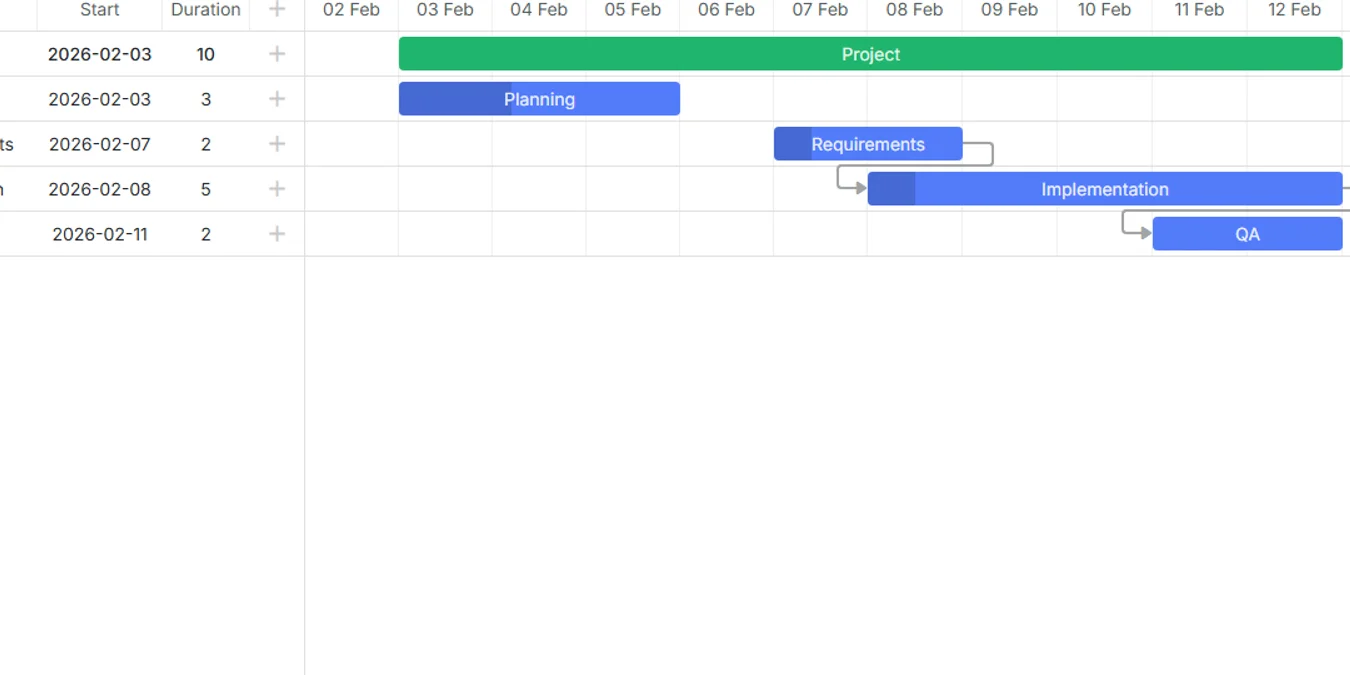
Edit task text, dates, and duration directly in the grid with built-in column editors.
Custom form
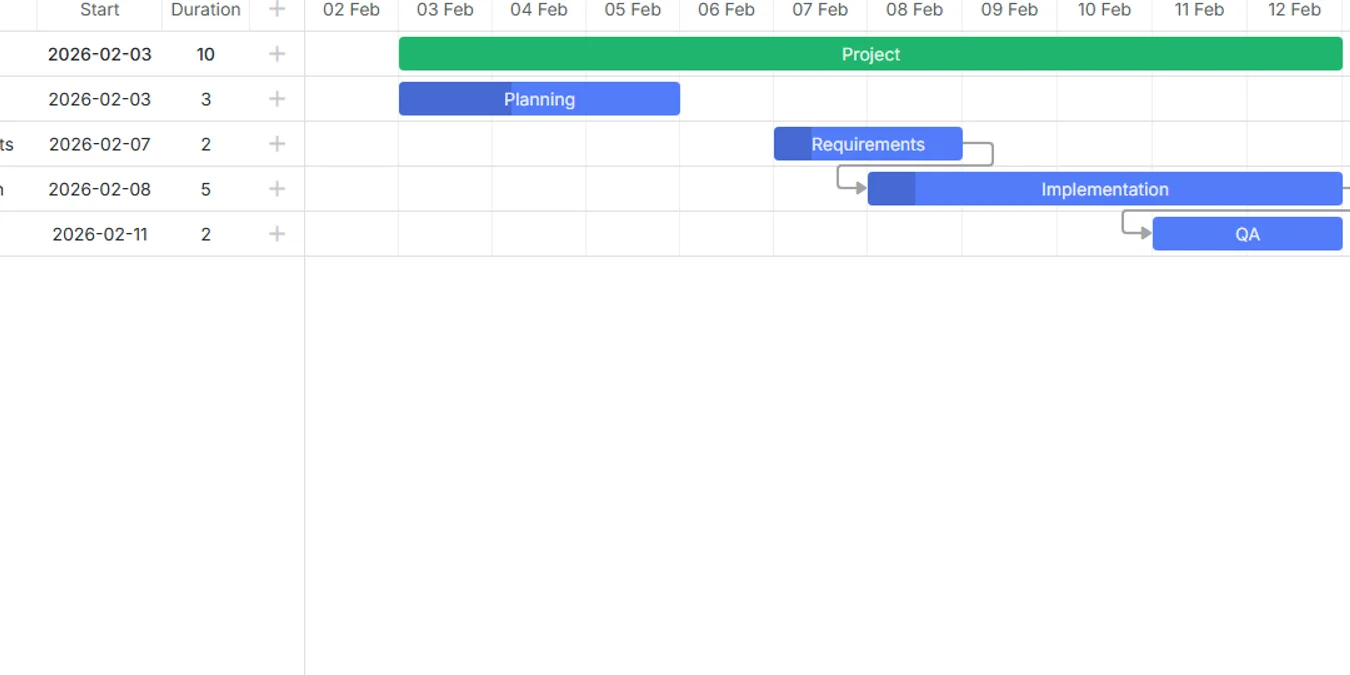
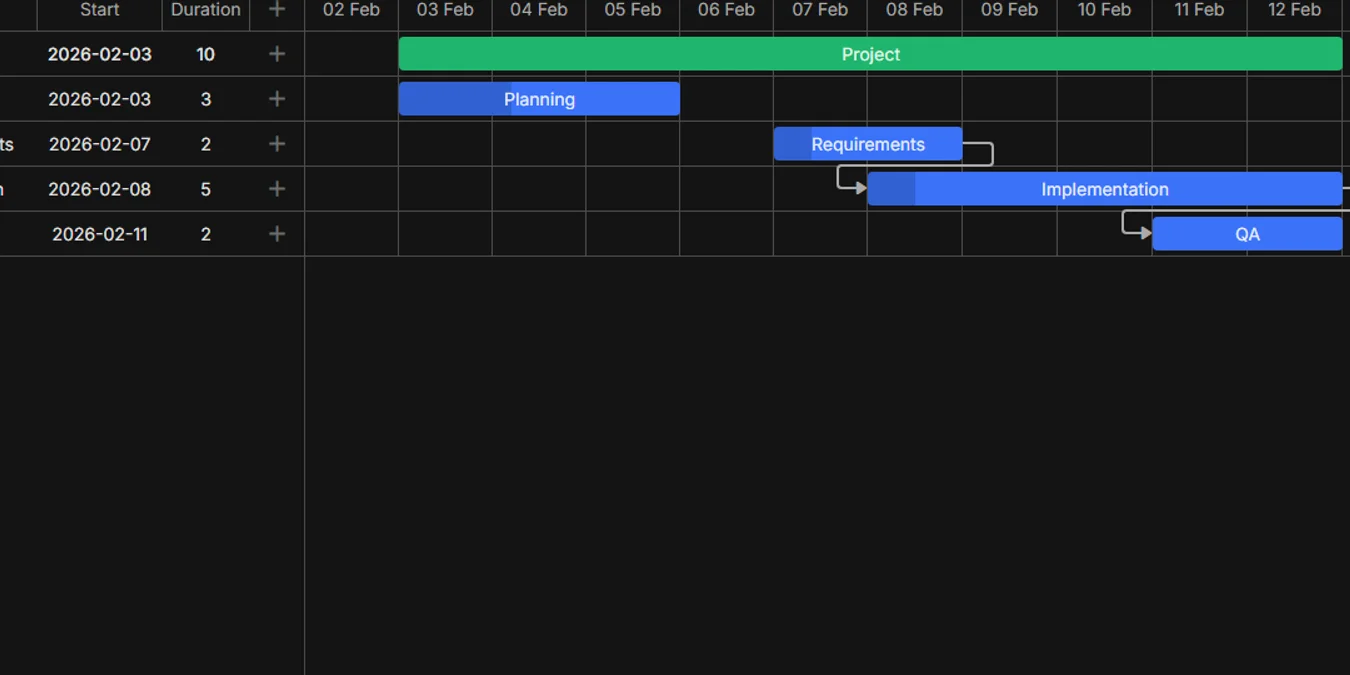
Replace the default task editor with a custom Angular lightbox component.
Advanced form
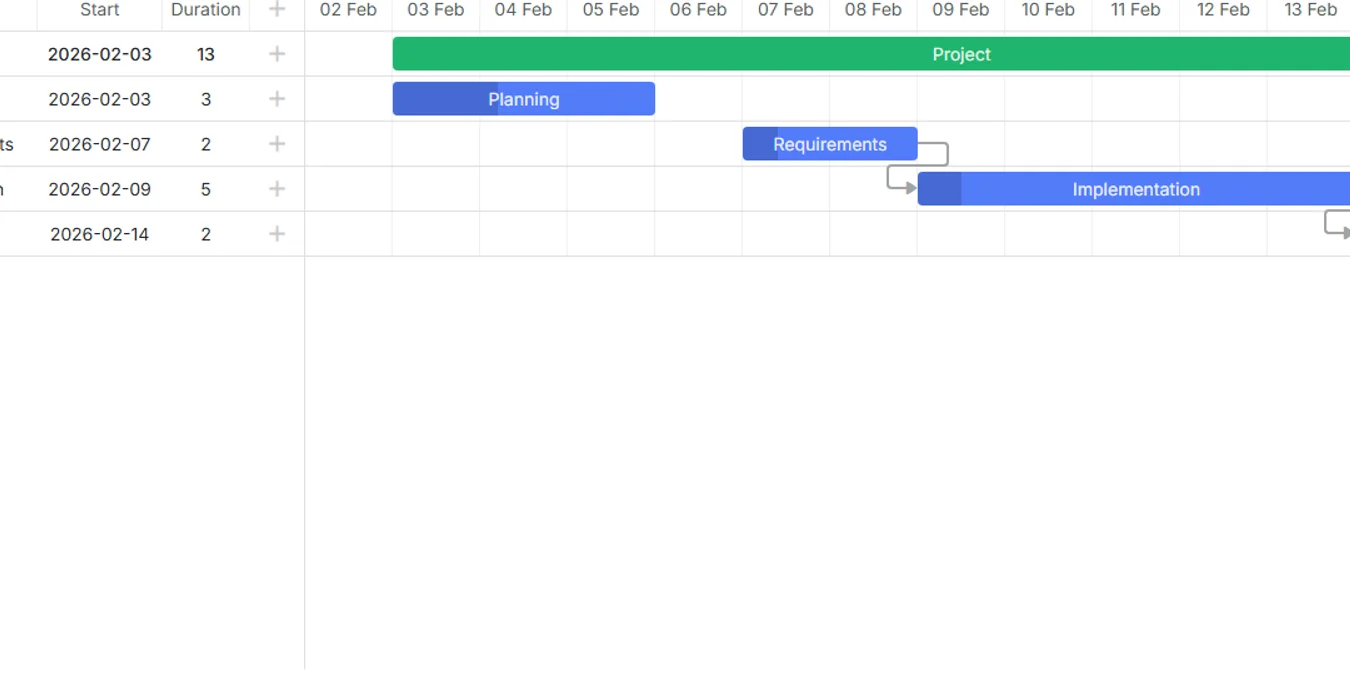
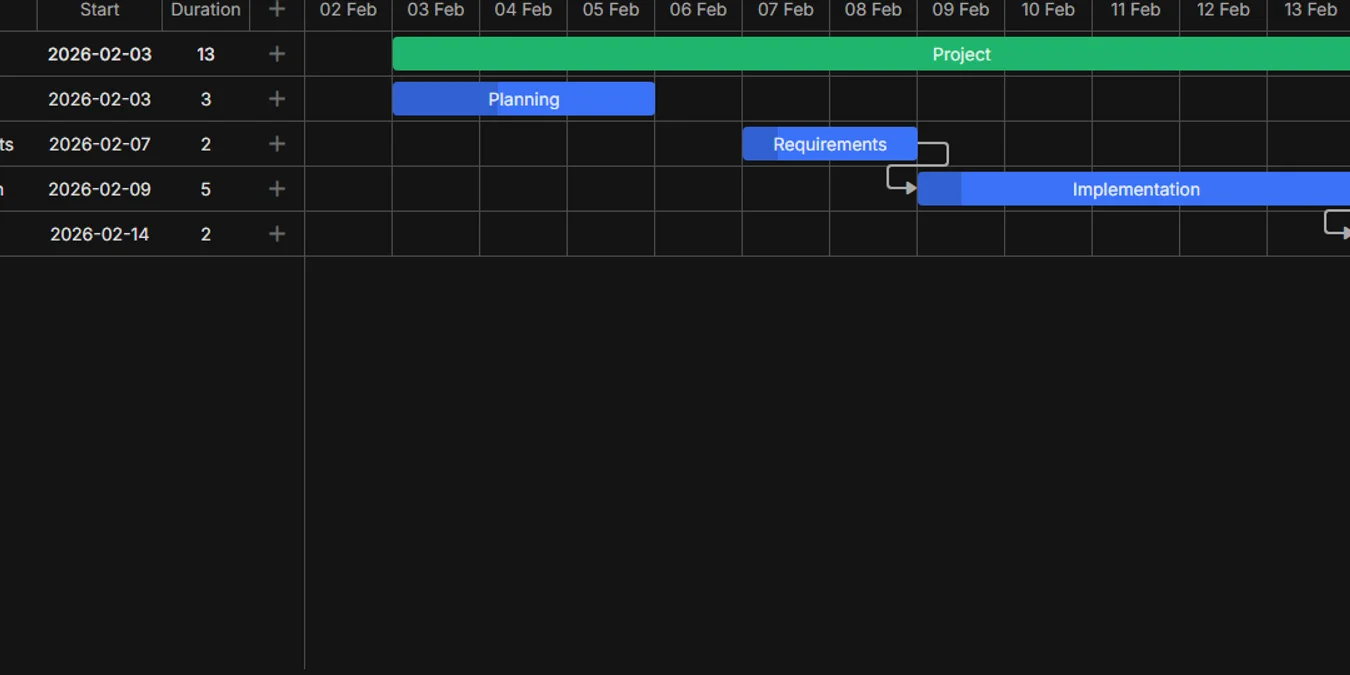
Combine a custom lightbox with auto scheduling for a richer task-editing workflow.
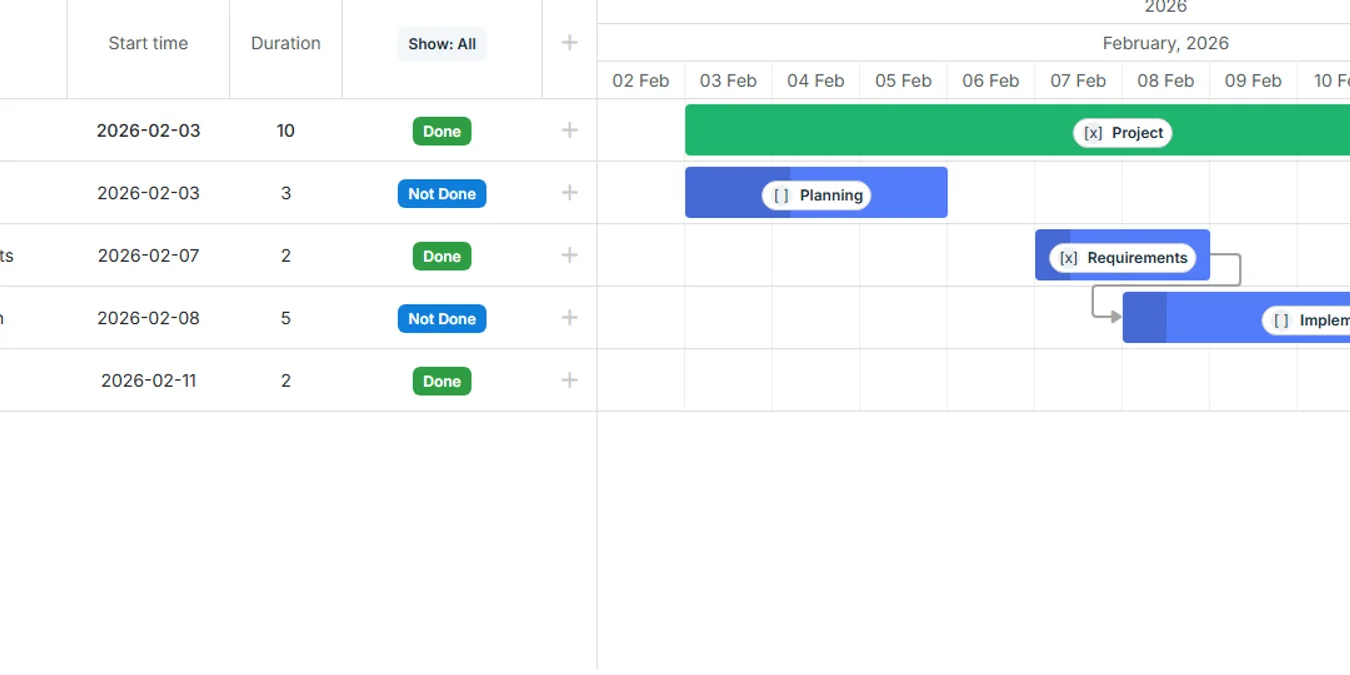
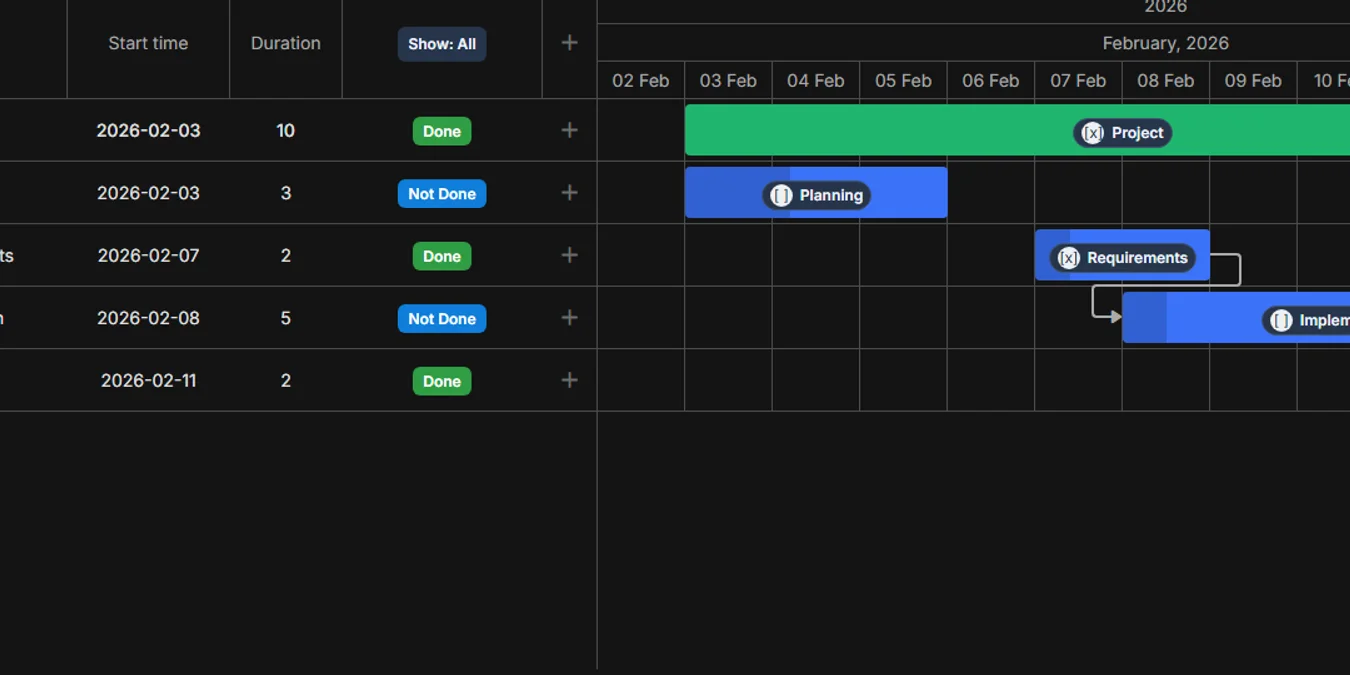
Template components
Render task text, status buttons, and header filters with standalone Angular template components.
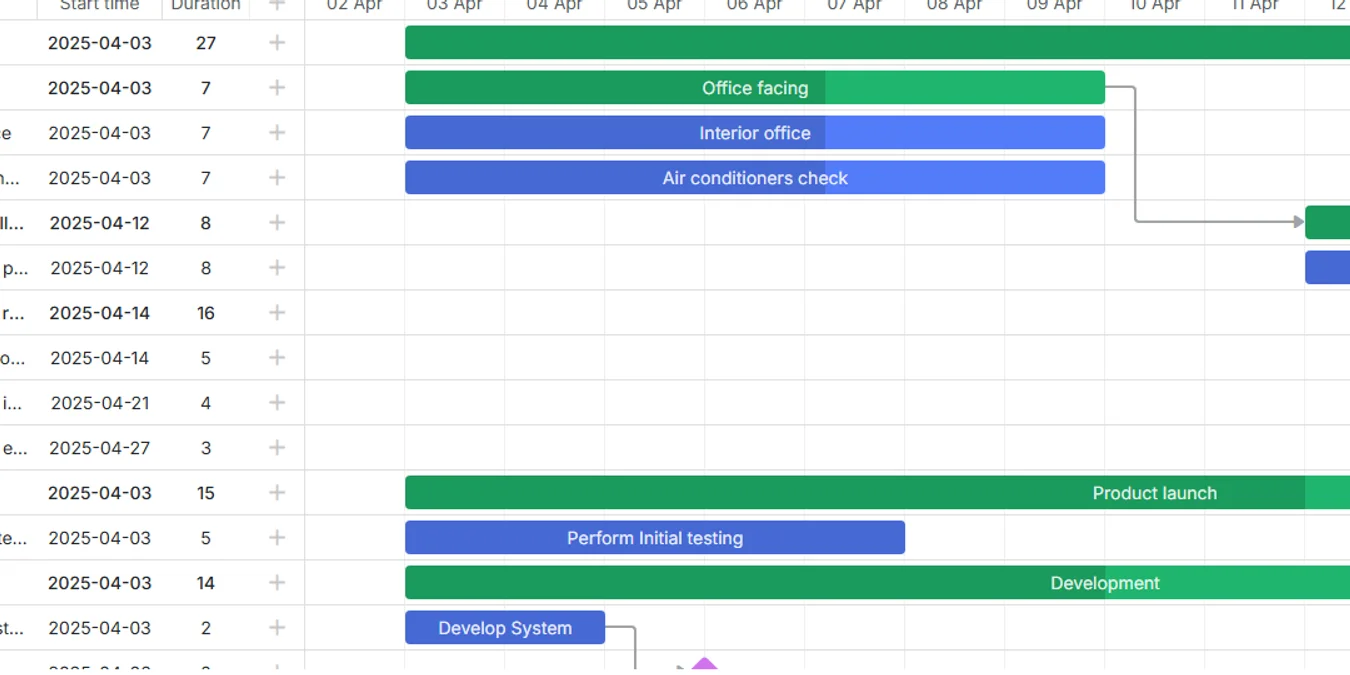
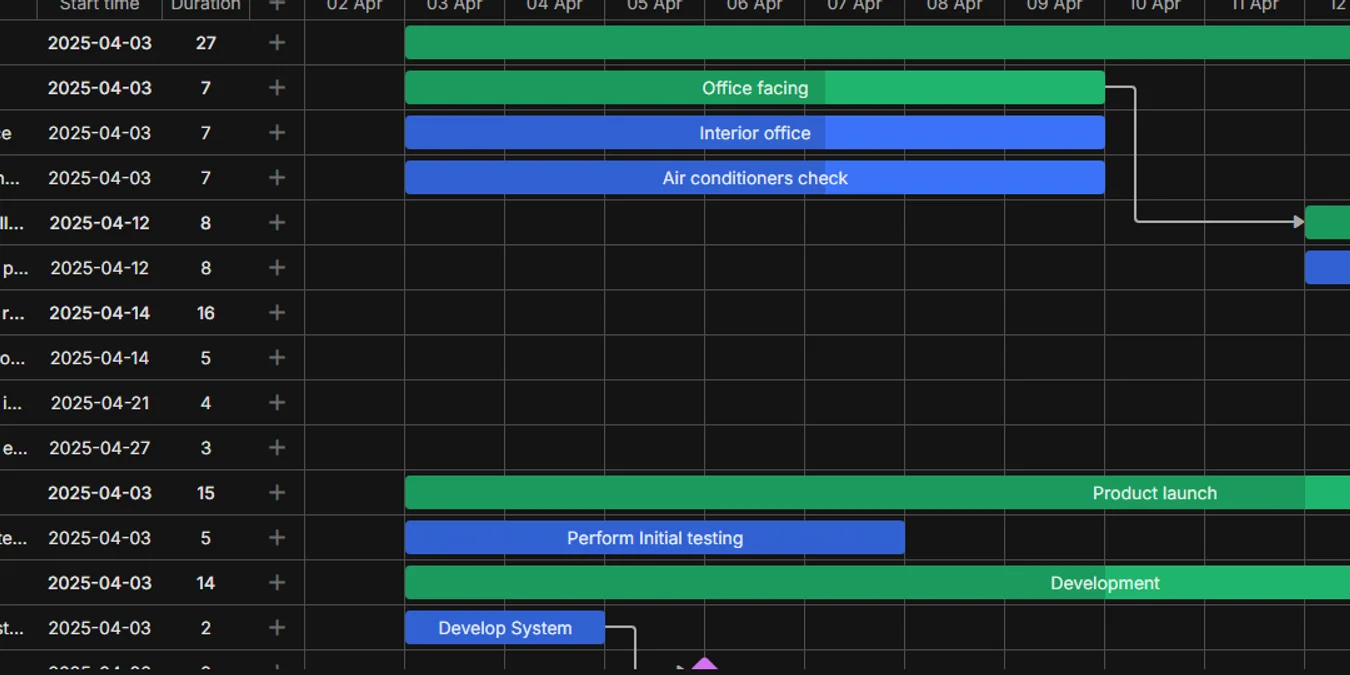
State management
Keep Gantt zoom level, undo, and redo state in an injectable Angular store.
Quick start
Minimal Angular project that mounts a Gantt chart with tasks and links, ready to clone and run.
Vue
10 examples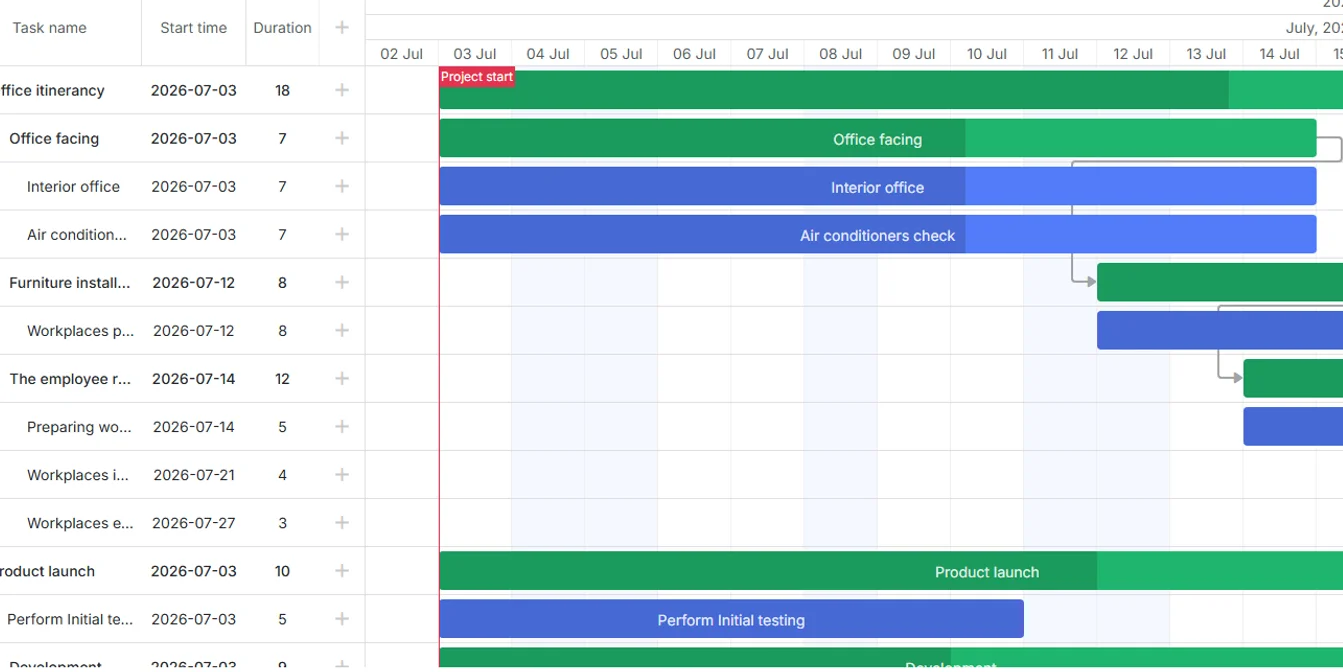
Basic initialization
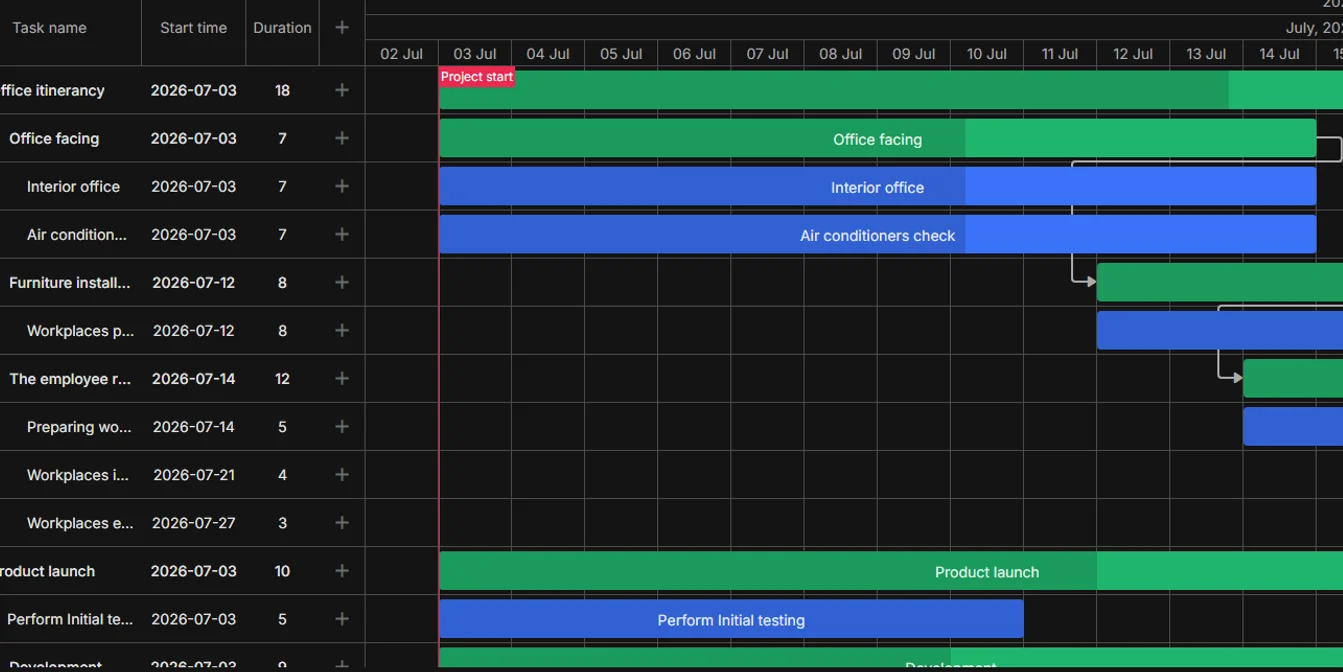
Create a Vue Gantt instance with tasks, links, calendars, and markers using the VueGantt component.
Templates
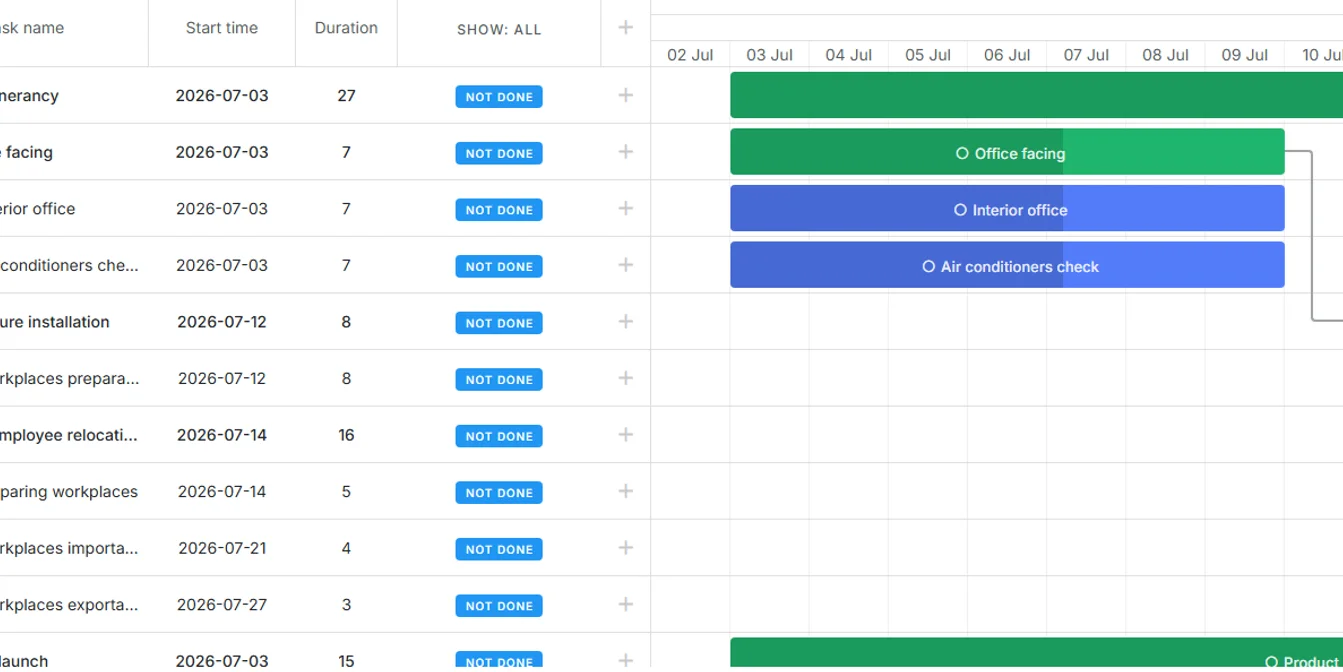
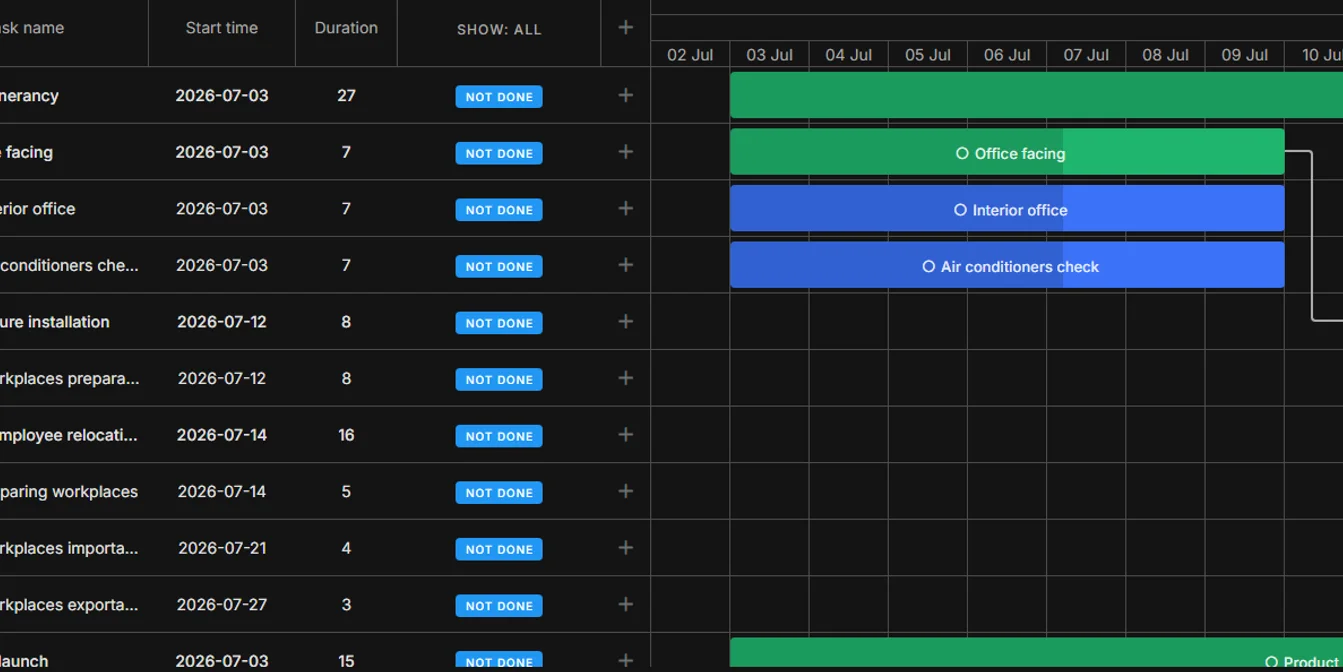
Customize task text, status controls, and the task delete dialog with Vue template components, plus theme and locale switching.
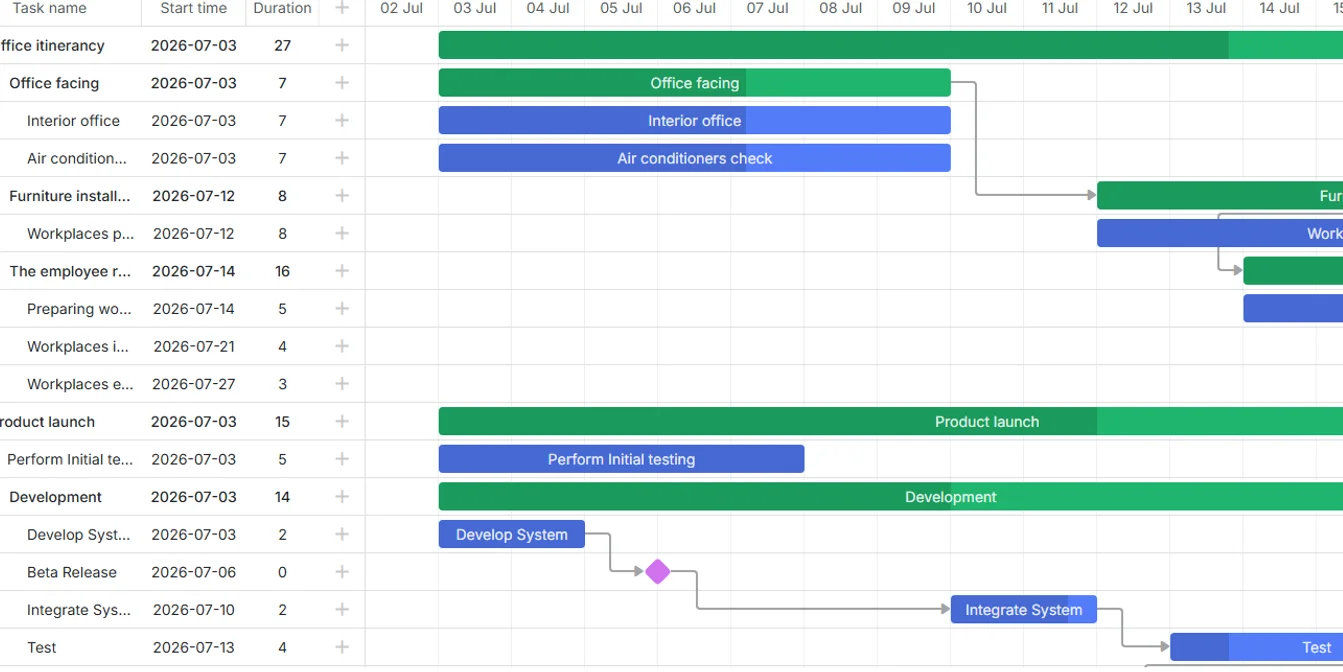
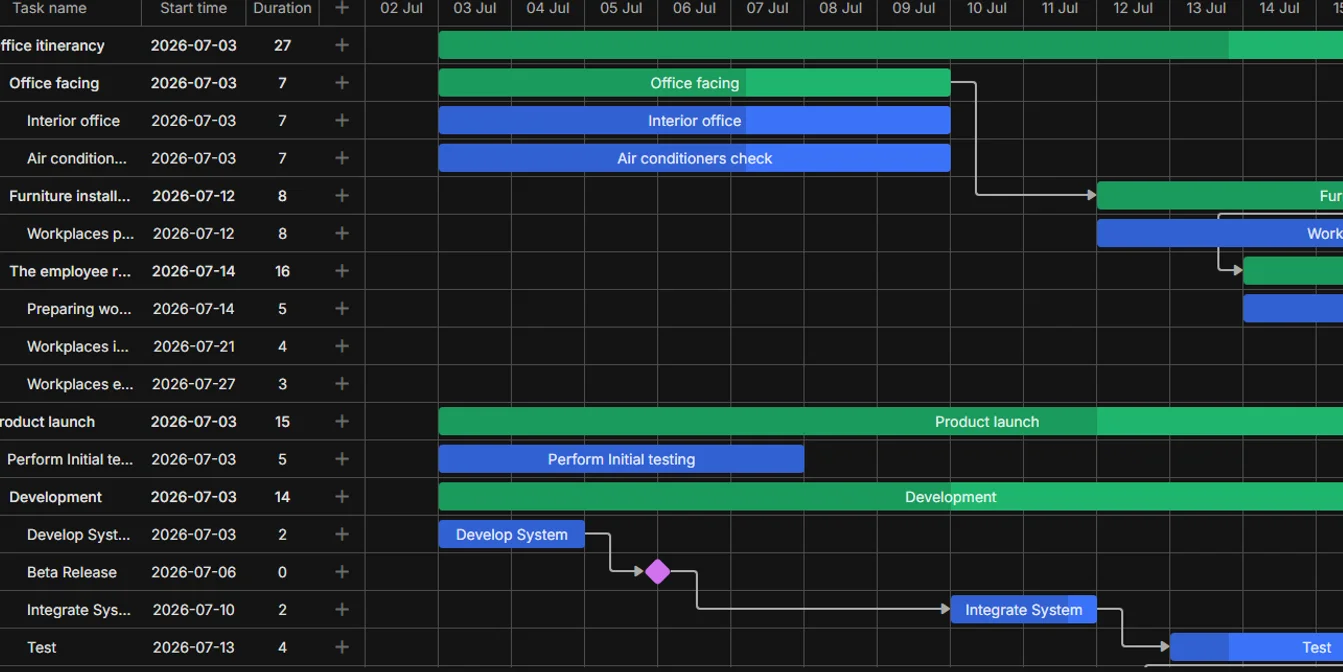
Custom form
Replace the default task editor with a custom Vue lightbox component using batched task updates.
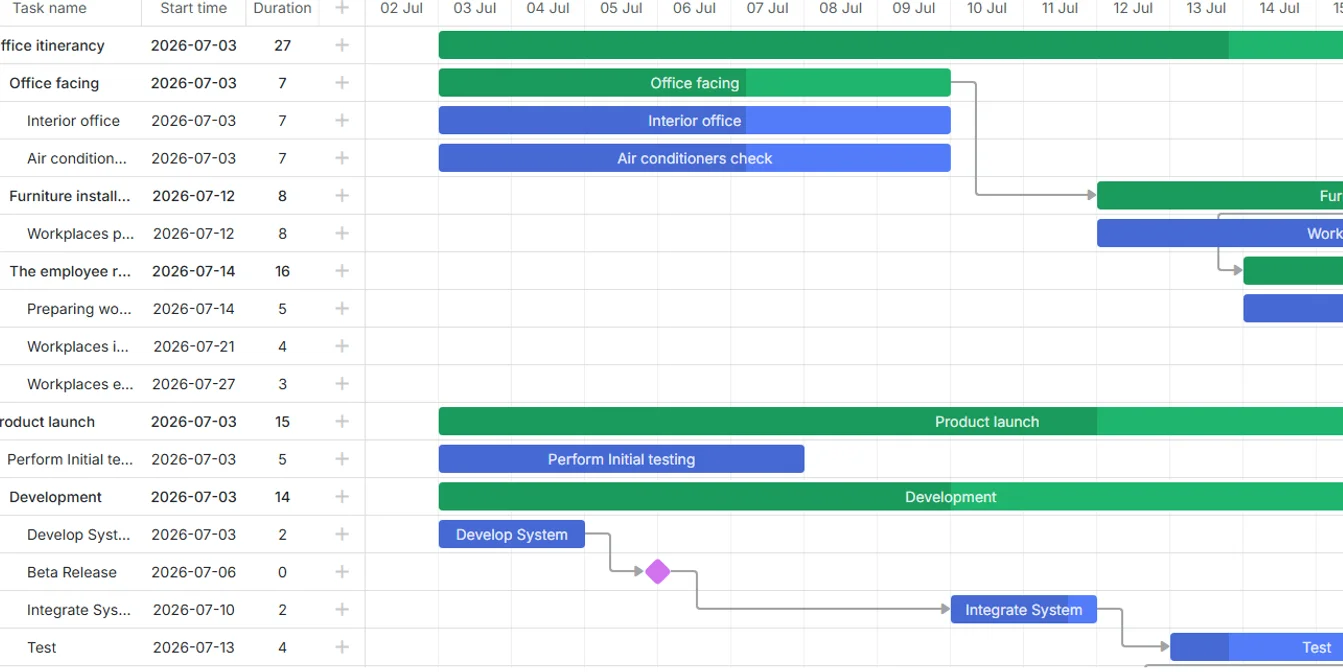
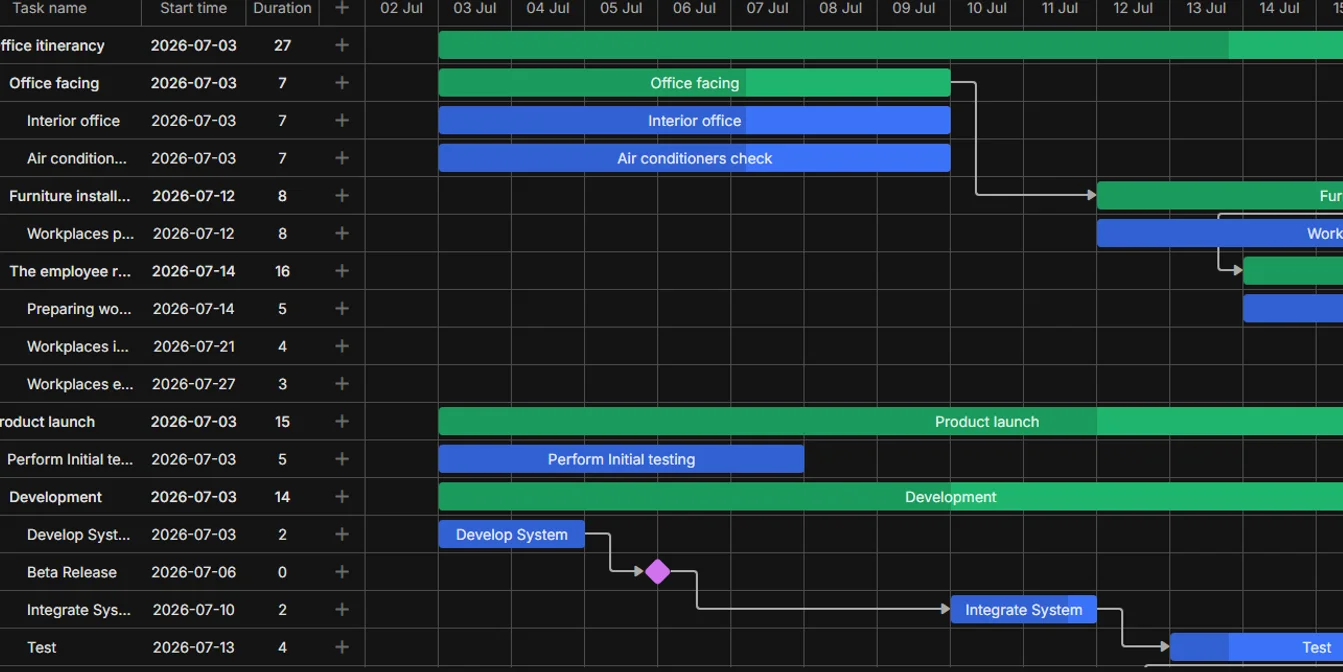
Custom edit view
Split task editing into a dedicated Vue Router view with shared Gantt context via provide/inject.
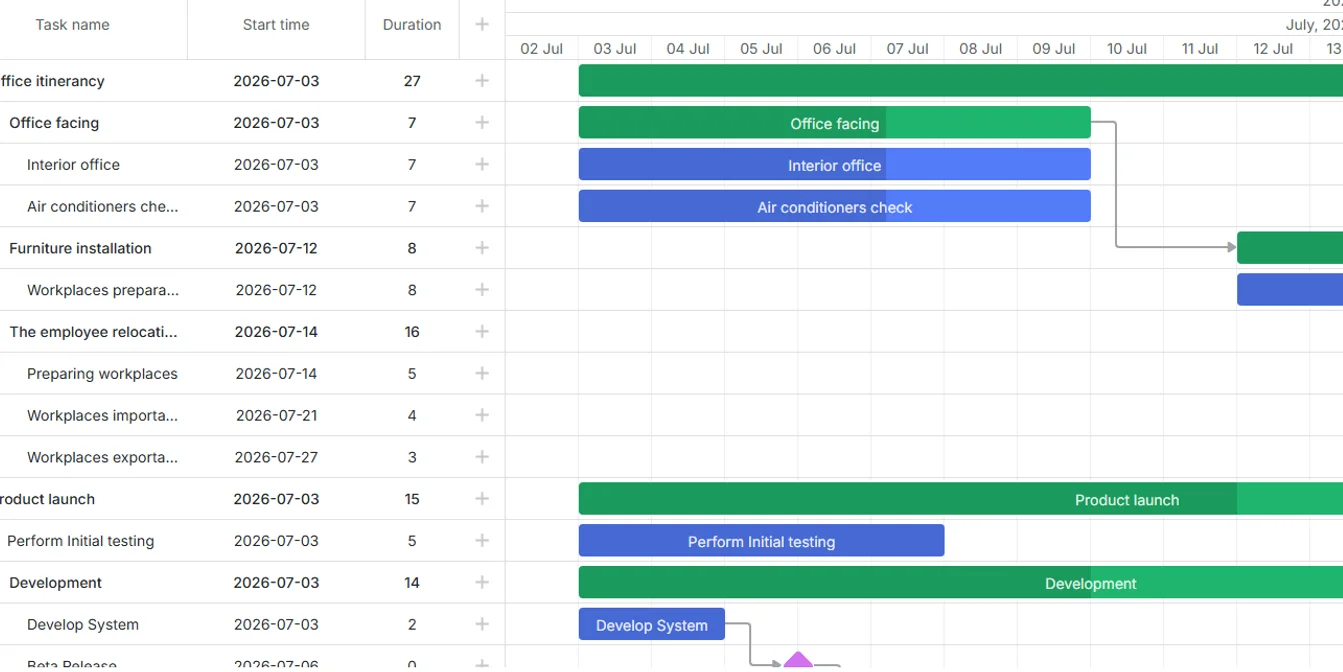
Inline editors
Use custom inline editors for text, duration, and date fields directly in the Gantt grid.
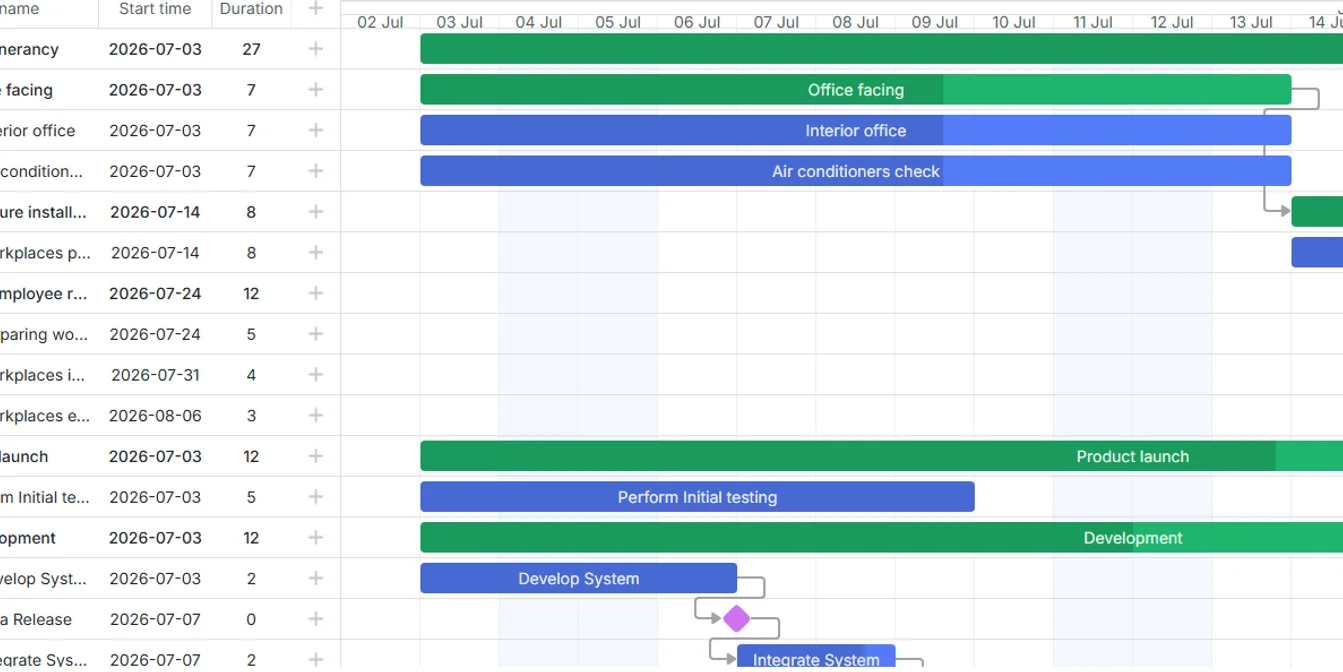
Auto scheduling
Recalculate dependent tasks and links when schedule changes should cascade through a project, with a critical path toggle.
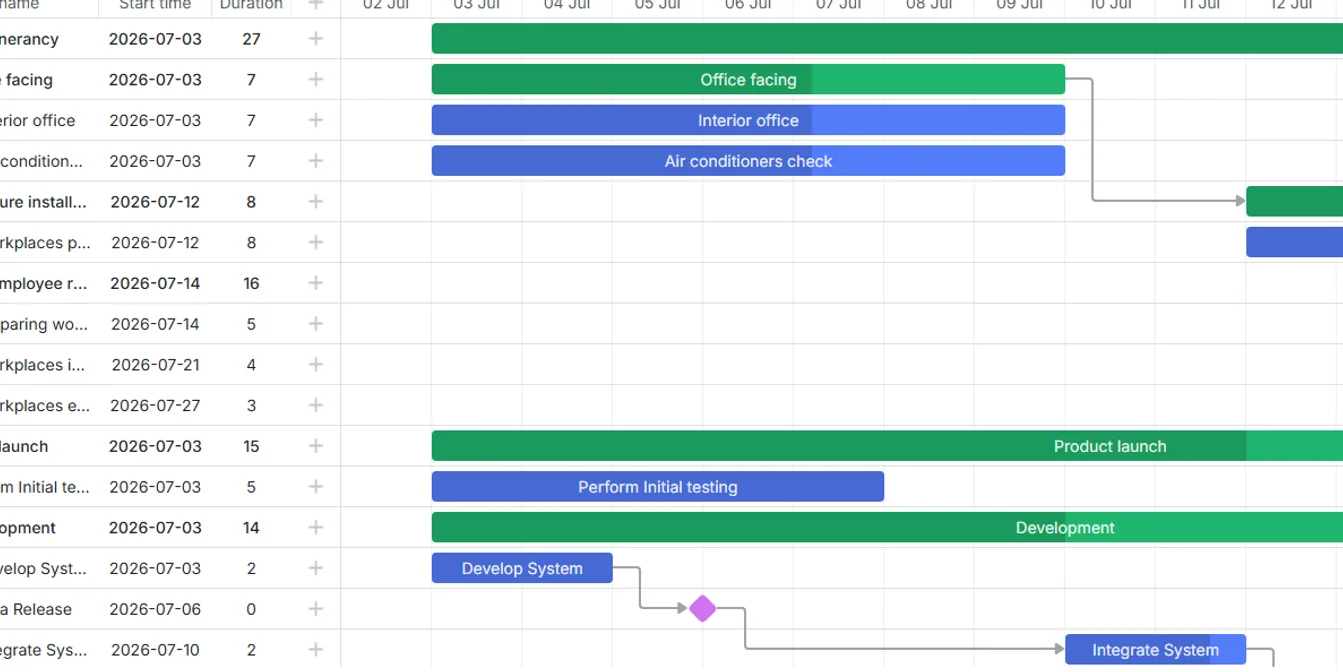
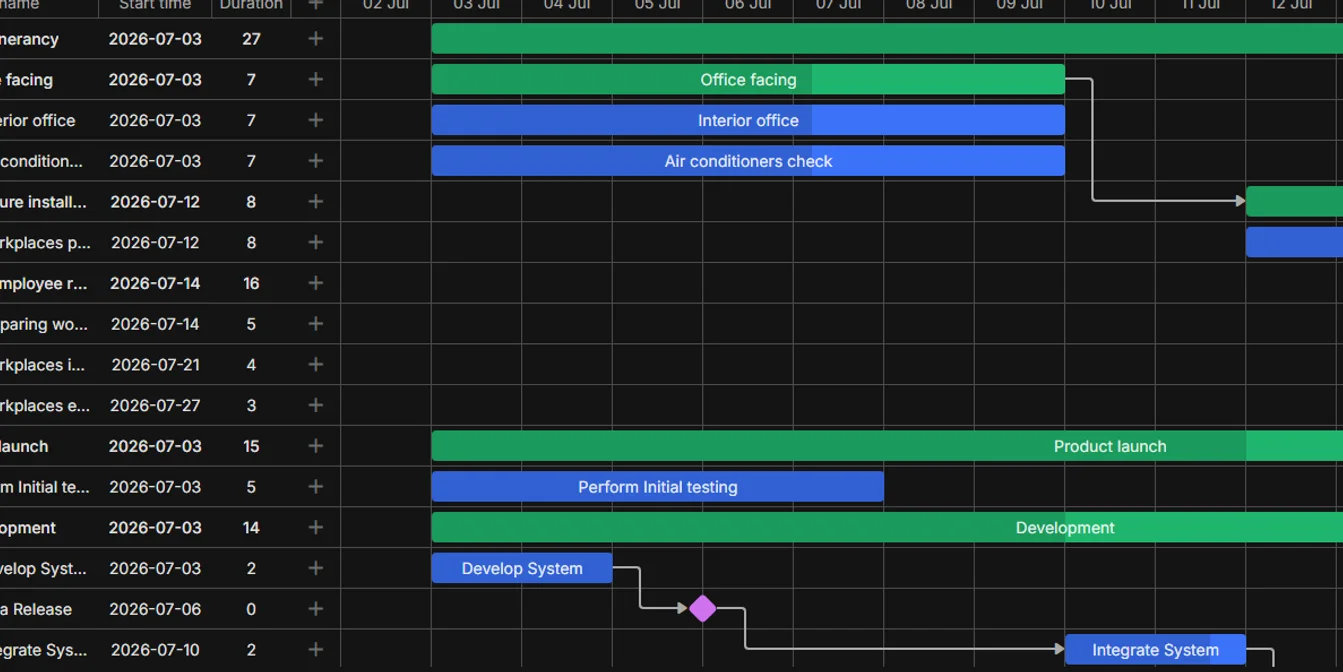
State management
Keep Gantt zoom level, undo, and redo state in a Pinia store.
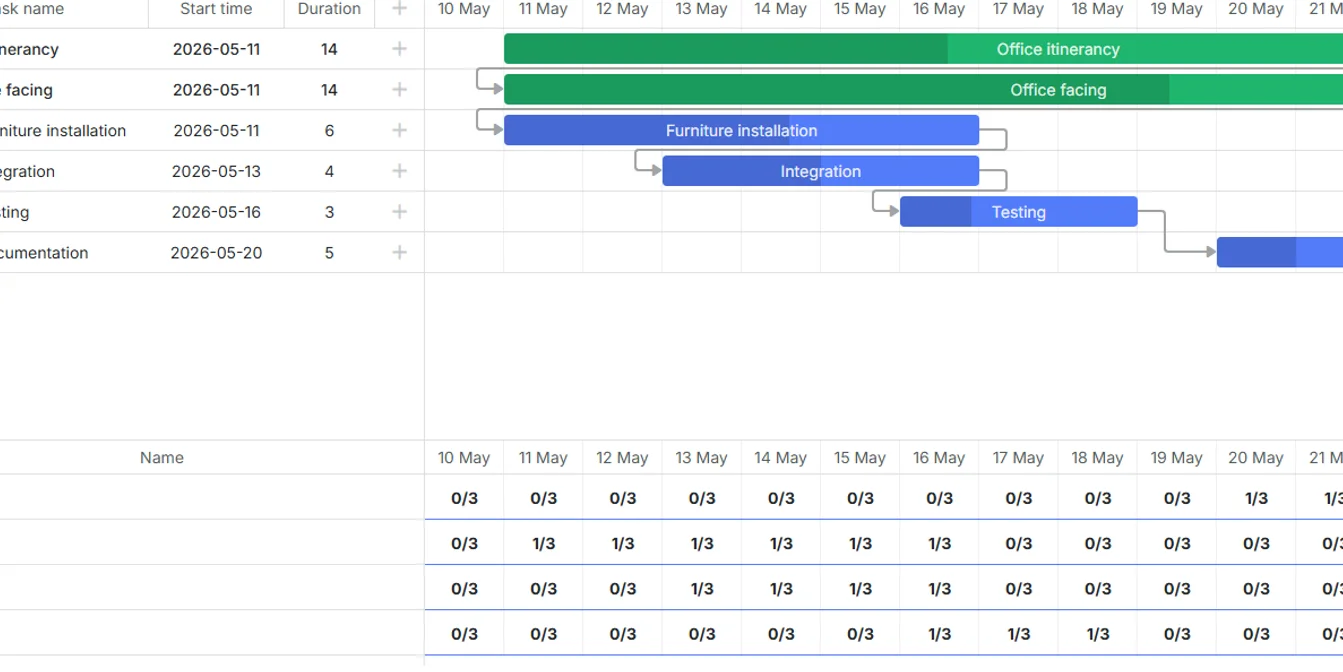
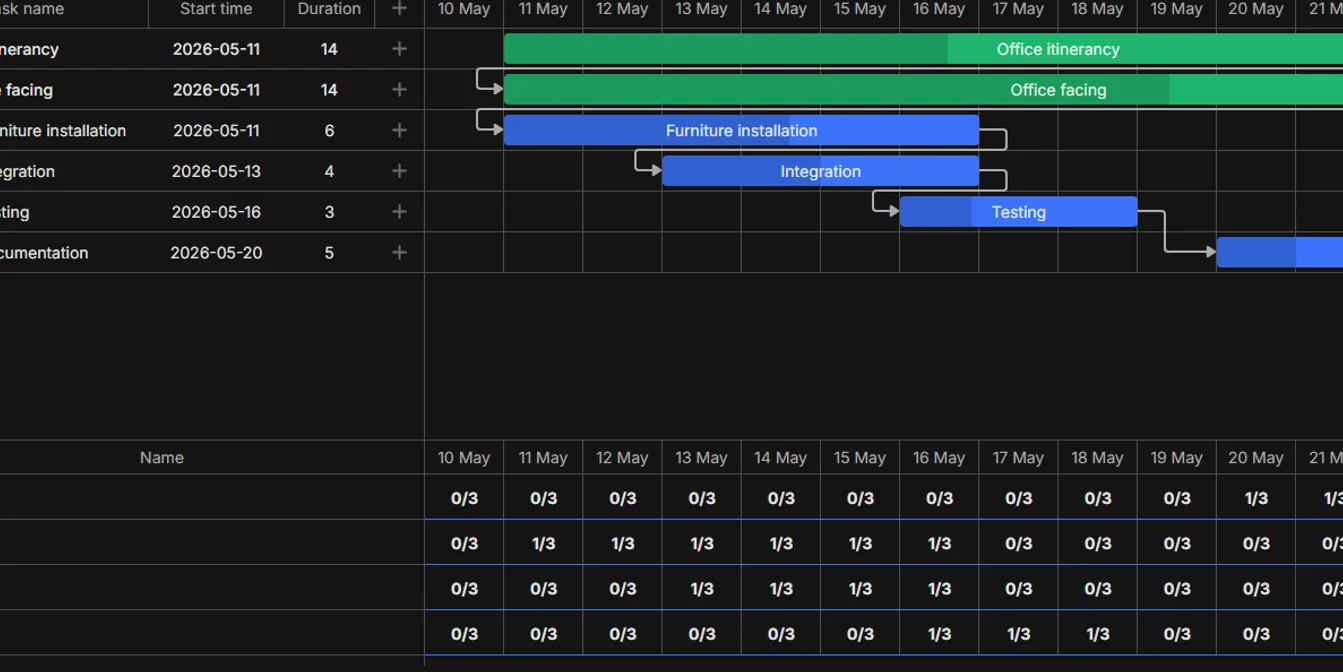
Resource panel
Show resource assignments and a histogram panel alongside the Gantt timeline.
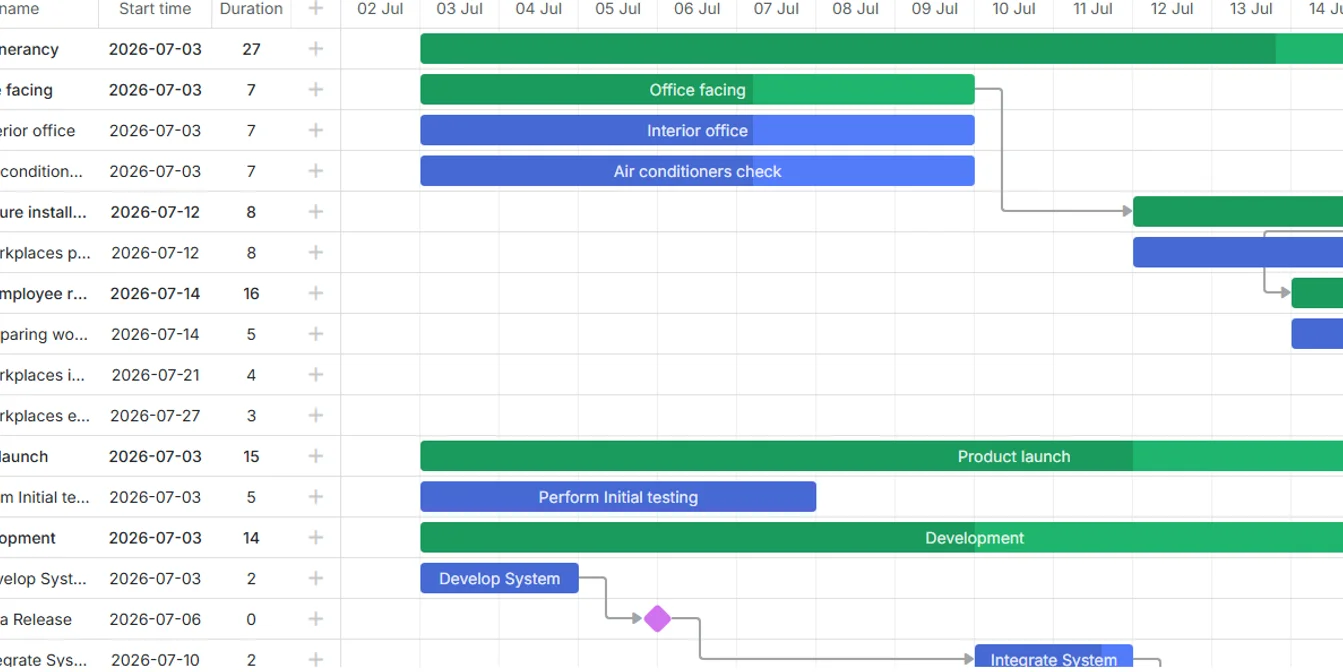
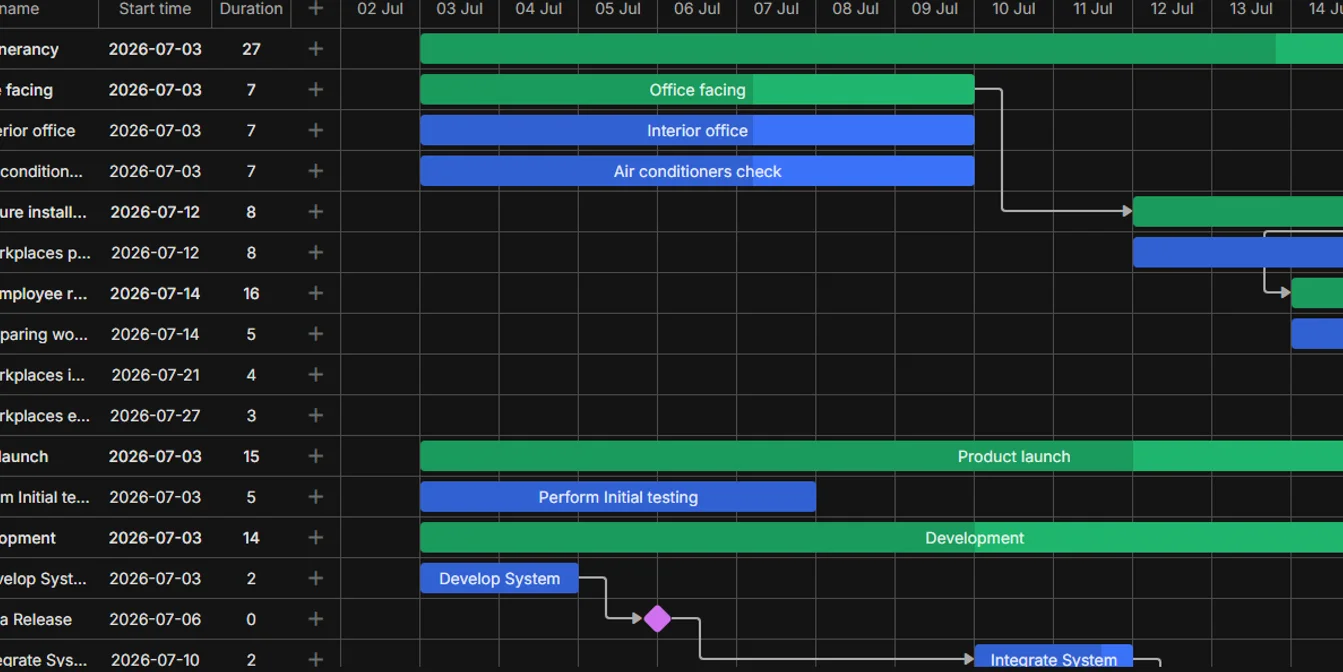
Export data
Export Gantt data to PDF, PNG, Excel, and MSP formats using the export API plugin.
Quick start
Minimal Vite-based Vue project that mounts a Gantt chart with tasks and links, ready to clone and run.
Backend & integrations
4 examplesSalesforce
Lightning Web Component that embeds a Gantt chart in Salesforce, backed by custom objects for tasks and links and an Apex data class.
Node.js
A Node.js and Express server that loads Gantt tasks and links from MySQL and saves every edit back over REST.
PHP Laravel
Laravel backend that exposes Gantt tasks and links through REST controllers and stores them with Eloquent models and migrations.
.NET Core
ASP.NET Core backend that serves Gantt tasks and links over a REST API backed by Entity Framework Core.